

Most marketers open Google Trends once, type in a keyword, stare at a squiggly graph for ten seconds, and close the tab. That’s the whole relationship. And honestly, that’s a waste, because Google Trends is one of the few free tools that shows you what people are actually curious about right now, not what they searched six months ago when some agency last updated their keyword sheet.
Here’s the thing nobody tells beginners: Google Trends isn’t a keyword research tool in the way Ahrefs or SEMrush is. It doesn’t give you search volume numbers or keyword difficulty scores. What it gives you is direction. It tells you whether interest in a topic is climbing, falling, flat, or about to spike because of some event you haven’t heard about yet. And for anyone doing content planning, running ads, launching a product, or managing social media, that kind of directional signal is gold if you know how to read it.
This guide walks through exactly how to use Google Trends for digital marketing, not the surface-level “type a word and look at the chart” version, but the version where you’re using it to plan content calendars, catch rising topics before your competitors do, time ad spend, and validate product ideas before you waste a budget on something nobody wants. By the end, you’ll know how to read the data correctly, avoid the mistakes that trip up most beginners, and actually turn Google Trends into a repeatable part of your marketing workflow.
What You Will Learn in This Guide
- How Google Trends actually calculates its numbers and why they’re relative, not absolute
- How to use Google Trends for keyword research and finding rising search terms early
- How to build a content calendar around seasonal and breakout trends
- How to time paid ad campaigns using Google Trends data
- How to validate product ideas before you spend money building them
- The most common mistakes marketers make when reading Google Trends data
- Answers to the questions people actually search about Google Trends
What Is Google Trends and Why It Matters for Digital Marketing
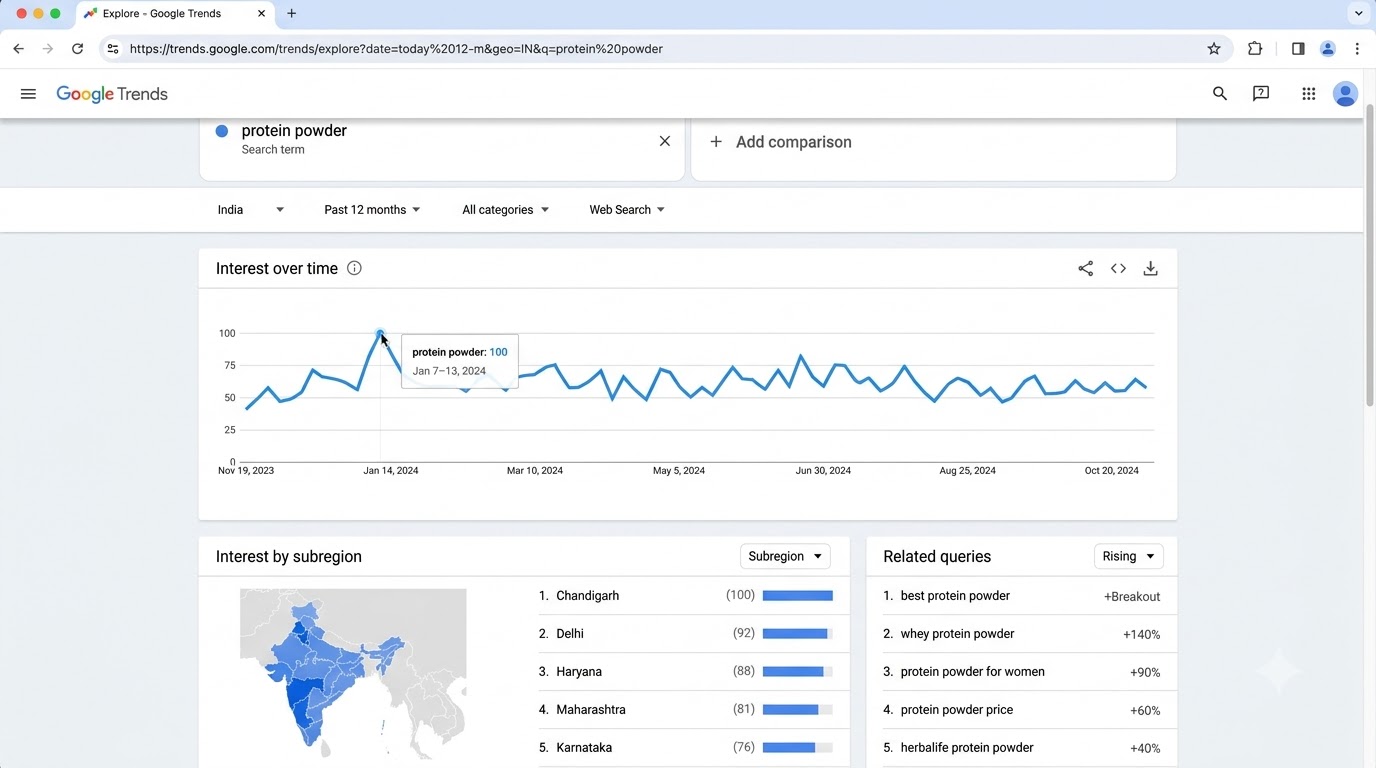
Google Trends is a free tool from Google that shows how search interest for a term changes over time, compared against the highest point of interest for that term in the selected time range and region. It doesn’t show raw search numbers. Instead, it shows a scaled score from 0 to 100, where 100 represents peak popularity for that term.
That distinction matters more than most people realize when they’re getting started. A score of 100 doesn’t mean a million searches. It just means that’s the highest relative point on the graph you’re looking at. This is why Google Trends works so well for spotting patterns and direction, but badly for estimating actual traffic potential. Use it for the “is this rising or falling” question, and use a proper keyword tool for the “how many people search this” question.
For digital marketers, this matters because most decisions aren’t really about exact numbers. They’re about timing. Should you publish this article now or wait three months? Should you launch this Facebook ad campaign this week or hold off? Is this product idea gaining traction or already past its peak? Google Trends answers those questions faster than almost anything else out there, and it’s free, which is more than you can say for most tools that claim to do the same thing.
How Google Trends Actually Works Behind the Scenes
Google Trends pulls from a random sample of Google Search data, not the full dataset. Google does this on purpose to keep the tool fast and to avoid revealing exact search volumes, which is proprietary information they don’t hand out for free. The sample is large enough to be statistically reliable for spotting trends, but it’s not built for precision, and that’s a trade-off you need to accept going in.
The data gets normalized against total searches in the selected location and time period. So if search interest overall goes up during a holiday season, Google Trends adjusts for that so you’re seeing relative interest in your specific term, not just a spike caused by more people searching in general. This is why two different searches for the same term on different days can occasionally show slightly different numbers. The dataset gets refreshed and resampled, and small variations are normal.
What most beginners miss is that Google Trends refreshes data differently depending on the time range you select. Data from the past few hours or days is close to real time. Data from a longer range, like five years, is a fixed daily or weekly sample that doesn’t change once it’s set. Knowing which mode you’re in changes how much weight you should put on small movements in the graph.
What the Numbers on Google Trends Really Mean
The 0 to 100 scale confuses a lot of people, so let’s break it down properly. If “protein powder” hits 100 in July and 40 in December, that doesn’t mean interest dropped to 40 percent of its original number in absolute terms. It means December’s search interest was 40 percent of whatever the peak point was during the time range you selected. Change the date range, and that 40 could shift to a completely different number, because the peak reference point shifts too.
This is exactly why comparing a Google Trends graph from a one-year view against a five-year view of the same keyword can look wildly different, even though the underlying search behavior is identical. The scale resets based on the highest point within your chosen window. Always check what time range you’re looking at before drawing conclusions, because the same data tells a different story depending on that window.
For content and campaign planning, treat these numbers as a compass, not a ruler. A rising line means growing interest. A falling line means declining interest. A flat line with occasional spikes usually points to a seasonal or event-driven topic. That’s the level of insight you should be pulling from the graph, not trying to reverse-engineer exact search counts, because that’s not what the tool is built to give you.
How to Use Google Trends for Keyword Research and Content Planning
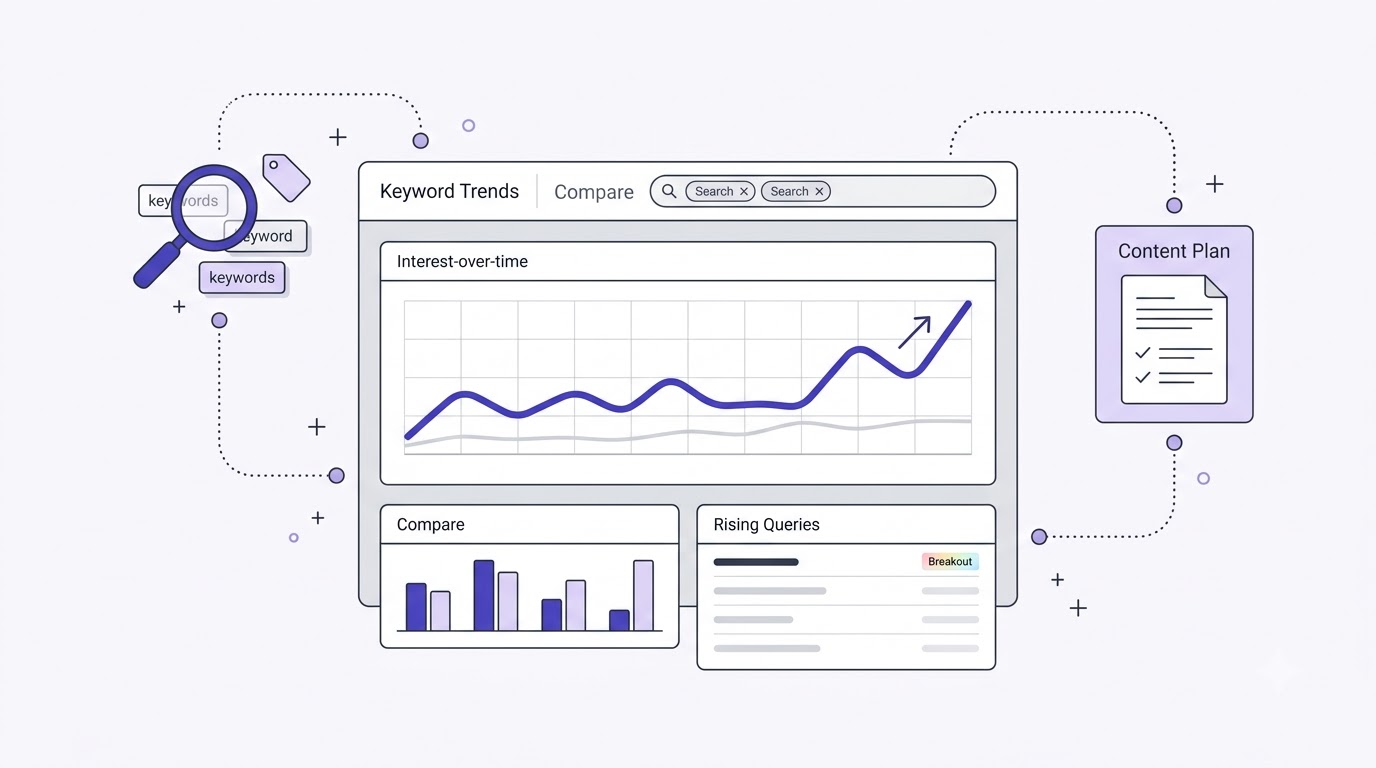
Google Trends becomes genuinely useful for keyword research the moment you stop using it alone and start layering it into your existing process. It won’t replace tools like Ahrefs or SEMrush for search volume and difficulty scores, but it does something those tools can’t: it shows you momentum before the volume data even catches up to it.
Search volume tools often report numbers based on historical averages, sometimes over the last twelve months. That means a keyword that just started trending this month might still show low or zero volume in those tools, because the data hasn’t caught up yet. Google Trends shows you that spike in real time, which gives you a window to publish content or launch a campaign before the term becomes competitive.
The workflow that actually works looks like this: use Google Trends to spot rising interest, cross-check the term in a proper keyword tool once volume data catches up, and then decide whether to commit real content or ad budget to it. This two-step process protects you from chasing trends that are pure noise while still letting you move fast on the ones that matter.
Finding Rising Keywords Before Competitors Do
Open Google Trends and go to the “Explore” section, then check the “Related queries” panel below the main graph. Google tags certain terms as “Breakout,” which means search interest grew by more than 5000 percent in the selected timeframe. These breakout terms are the closest thing to an early warning system that exists in free SEO tools, and most people scroll right past them without noticing.
When you see a breakout term related to your niche, don’t just publish a quick post and move on. Dig into why it’s breaking out. Search the term on Google itself and look at what’s currently ranking. If the top results are thin, outdated, or from low-authority sites, that’s your signal to publish something genuinely better and faster than anyone else in that gap. Speed matters here because breakout terms often have a short window before bigger sites catch on and flood the space with content.
A mistake a lot of people make at this step is publishing content the moment they see a breakout term without checking if the interest is sustainable or a one-day fluke tied to a viral post or news event. Not every breakout deserves a full article. Some deserve a quick social post or a short update to an existing piece instead of a brand new page that might be irrelevant in a week.
Comparing Multiple Keywords on Google Trends
The “Compare” feature lets you plot up to five terms on the same graph, which is one of the most underused parts of the tool. Type your primary keyword, then add close variants or competing terms, and watch how they move relative to each other over your chosen time period. This tells you which phrasing people are actually gravitating toward, which matters a lot when you’re choosing the exact wording for a title tag or a headline.
For example, someone writing about running shoes might compare “running shoes for beginners” against “best running shoes” and “running shoes for flat feet.” The graph will show which phrase consistently pulls more relative interest, and sometimes the winner surprises you. Search behavior doesn’t always match what marketers assume people are typing, and this comparison view corrects that assumption fast.
The mistake most people make here is comparing terms that aren’t semantically close enough to be useful, like comparing a brand name against a generic category term. The scale adjusts to whichever term has the highest peak, so if you throw in an unrelated high-volume term, it flattens everything else on the graph and makes the comparison meaningless. Keep your comparisons tight and relevant to get a reading you can actually act on.
Using Related Queries and Related Topics
Below every Google Trends graph sit two panels: “Related topics” and “Related queries.” These aren’t the same thing, and treating them as interchangeable is a common beginner mistake. Related topics show broader themes connected to your search term, based on Google’s own topic clustering. Related queries show the actual phrases people typed alongside or around your term.
Related queries are where the real content ideas live. If you’re researching “meal prep,” the related queries panel might surface things like “meal prep containers,” “meal prep for weight loss,” or “meal prep ideas for the week,” each with its own rising or top designation. Rising means it’s gaining traction relative to before. Top means it’s consistently searched at high volume already. Both are useful, but they serve different purposes: rising queries are for getting ahead of demand, top queries are for building your pillar content around proven demand.
Go through this panel for every core topic in your niche at least once a quarter. Search interest shifts, and a related query that was flat six months ago might now be sitting at “Breakout” status. Building this check into a recurring habit, even a simple fifteen-minute pass every few weeks, keeps your content calendar aligned with what people are actually searching instead of what you assumed they’d search when you first built your keyword list.
Using Google Trends for SEO Strategy and Content Calendars
A content calendar built purely on evergreen keyword research misses half the opportunity, because it doesn’t account for timing. Google Trends fixes that gap by showing you exactly when interest in a topic peaks and dips throughout the year, which lets you plan publish dates that line up with actual demand instead of guessing.
This is especially powerful for niches with strong seasonality, like fitness, tax prep, holiday shopping, or wedding planning, but it’s genuinely useful for almost any niche once you dig in. Even B2B topics have seasonal patterns tied to fiscal years, budget cycles, and industry events, and most marketers never check because they assume seasonality is only relevant for consumer products.
The strategy here is simple but often skipped: pull twelve months of Trends data for your top ten to fifteen core topics, note the months where each one peaks, and build your content calendar backward from those peak points. Publishing and optimizing content four to six weeks before a seasonal peak gives Google time to index and rank the page before the demand window opens, instead of scrambling to publish once the spike has already started.
Spotting Seasonal Trends With Google Trends
Set the time range on Google Trends to “2020-present” or a similar multi-year window for any keyword you suspect has seasonal behavior. If you see the same pattern repeat year after year, roughly the same shape and timing each cycle, you’ve confirmed genuine seasonality rather than a one-time spike caused by a news event or viral moment.
Take a topic like “Halloween costume ideas.” Every single year, that term climbs steadily starting in early September, peaks hard in the final week of October, and crashes almost immediately after November 1st. That’s not a coincidence, and if you’re publishing Halloween content in October, you’re already too late to catch the early search volume, because the ideal window to have that content ranked and indexed is late August through early September.
Use this seasonal mapping to build a rolling twelve-month content calendar for your niche. Mark each seasonal peak on a calendar, count backward six to eight weeks for publishing and initial optimization, and set reminders to update or refresh that content the following year before the next cycle begins. Content built this way consistently outperforms reactive content because it’s live and indexed before the competition even starts thinking about the topic.
Building a Content Calendar Around Google Trends Data
Once you’ve mapped seasonal peaks, layer in the breakout and rising terms you’re tracking from the related queries panel discussed earlier. Your calendar should have two tracks running at once: a predictable seasonal track built months in advance, and a reactive track that fills in gaps whenever a genuine breakout term shows up in your niche.
For the seasonal track, batch your planning quarterly. Sit down every three months, pull updated Trends data for your core topics, and adjust publish dates if patterns have shifted even slightly. Search behavior does drift over time, sometimes because of algorithm changes on Google’s end, sometimes because of shifts in how people phrase things, so treating last year’s calendar as gospel without rechecking is a mistake that costs you ranking opportunities.
For the reactive track, keep a standing checklist of your niche’s top keywords and run them through Google Trends every couple of weeks, specifically checking the related queries panel for new breakout terms. When something new pops up that fits your niche, decide fast whether it deserves a dedicated piece or a quick update to existing content. This is where a proper keyword research and content planning process pays off, because you already know your site’s content gaps and can slot new opportunities in without duplicating existing pages.
Combining Google Trends With Search Console Data
Google Trends tells you what people are searching for broadly. Google Search Console tells you what’s already happening on your specific site. Combining both gives you a much sharper picture than either tool alone, and most marketers never think to cross-reference them.
Here’s a practical way to do it. Pull your top twenty queries from Search Console’s Performance report, sorted by impressions over the last three months. Then run each of those queries through Google Trends to see whether interest is rising, flat, or declining. If a query is already sending you impressions and Trends shows it rising, that page deserves fresh content, updated internal links, and maybe an expanded FAQ section, because you’re about to catch a growing wave, not a shrinking one.
On the flip side, if Search Console shows a query with strong impressions but Google Trends shows that interest is fading, that’s a signal to not over-invest further resources into expanding that content. Instead, maintain what’s there and shift new content investment toward topics Trends shows climbing. This combination turns two free tools into something close to a paid forecasting tool, without spending a rupee on software.
Google Trends for Social Media, Ads, and Product Launches
Google Trends isn’t just an SEO tool. It’s genuinely useful for anyone timing paid campaigns, planning social content calendars, or trying to figure out whether a product idea has real demand before spending money on it. The same directional insight that helps with content planning applies just as well to ad spend and launch timing.
Paid campaigns especially benefit from Trends data because ad costs fluctuate with demand. Bidding on a keyword right before its seasonal peak, when competition is still low, gets you cheaper clicks than waiting until everyone else has noticed the spike too. That timing edge alone can meaningfully cut your cost per acquisition on platforms like Google Ads and Meta Ads, where auction pricing responds directly to advertiser demand.
Product launches carry even more risk without this kind of check. Building a product around a trend that peaked eighteen months ago and has been declining ever since is a real way marketers lose budget, and it happens more often than people admit. A five-minute check on Google Trends before committing to a product line or a campaign theme is one of the cheapest insurance policies in marketing.
Using Google Trends for Paid Ad Timing
Before launching a seasonal ad campaign, pull the last three to five years of Google Trends data for your core product or service term. Note exactly when interest starts climbing each year, not just when it peaks. That climb point, usually four to six weeks before the peak, is your ideal campaign launch window, because it lets you build momentum and gather data before the auction gets crowded and expensive.
Waiting until peak season to launch means competing against every other advertiser who had the same idea, which drives up cost per click fast. Launching during the early climb gives your campaign time to optimize, gather conversion data, and build audience signals before the auction gets competitive. By the time everyone else jumps in during peak weeks, your campaign already has performance history working in its favor.
A mistake worth flagging here: don’t assume every year follows the exact same pattern without checking. External factors like economic conditions, industry shifts, or even a single viral event can shift a seasonal pattern earlier or later than usual. Always check the most recent one to two years against the longer-term average before locking in a launch date, rather than relying purely on a five-year-old pattern that might not hold anymore.
Validating Product Ideas With Google Trends
Before building a product, landing page, or even a full marketing campaign around an idea, run the core concept through Google Trends first. Compare it against related or competing terms to see where genuine, sustained interest sits. A product idea that shows a sharp spike followed by a steep, permanent decline is a fad, not a foundation, and building a business around it without accounting for that decline is a real financial risk.
Look specifically at the shape of the graph, not just the current position. A term that’s been climbing steadily for two years and shows no sign of plateauing is a much safer bet than one that spiked hard three months ago and is already dropping. Steady, sustained climbs usually reflect genuine, durable shifts in consumer behavior. Sharp spikes usually reflect a viral moment, a single influencer post, or a news cycle that won’t repeat.
Also check the “Interest by region” section for any product idea you’re validating. If interest is heavily concentrated in one or two regions and flat everywhere else, that changes your whole go-to-market plan, including where you allocate ad spend, which language you use in creative, and whether a national launch even makes sense yet compared to starting regional first.
Regional and Local Trends for Hyperlocal Campaigns
Google Trends breaks data down by country, state, and even city level in many regions, which is a massively underused feature for local businesses and hyperlocal marketing campaigns. If you’re running a business in a specific city or state, generic national trend data often misleads you, because local search behavior can differ significantly from the national average.
Use the “Interest by subregion” map on any Trends graph to see exactly where a search term is strongest. For a local business, this tells you where to concentrate ad spend, which cities to prioritize for local SEO content, and even which local events or seasonal patterns are worth building campaigns around that a national brand would never notice or bother with.
This becomes especially powerful when combined with Google’s “Trending searches by region” feature, which surfaces real-time spikes at a hyperlocal level. A local restaurant chain, for instance, can catch a regional food trend early and build a limited-time menu item or social campaign around it days before a national brand even notices the pattern forming, simply because they’re watching regional data instead of only national averages.
[Screenshot: Google Trends Interest by Subregion map view showing a color-coded heatmap for a keyword across different states]
Common Mistakes Marketers Make With Google Trends
Even experienced marketers misread Google Trends data regularly, mostly because the tool looks simple on the surface but has a handful of quirks that change how you should interpret every graph you look at. Knowing these mistakes upfront saves you from making decisions based on a misread chart.
The pattern behind most of these mistakes is the same: treating relative, scaled data as if it were absolute, precise data. Google Trends was never built to hand you exact numbers, and forcing it to answer questions it wasn’t designed for is where most of the confusion starts. Once you internalize that the tool is directional, not precise, most of these mistakes become easy to avoid.
Below are the three mistakes that show up most often, each one worth checking against your own habits before you build another campaign or content calendar off Google Trends data.
Misreading Relative Data as Absolute Search Volume
This is the single most common mistake, and it’s already been touched on earlier in this guide, but it deserves its own callout because of how often it causes real strategic errors. A score of 60 on Google Trends does not mean 60 searches, 60,000 searches, or any specific number at all. It’s a relative score against the peak point within your selected time range and region, and nothing more.
Marketers sometimes present Google Trends charts to clients or stakeholders as if they show actual traffic potential, which sets false expectations. If a term shows a Trends score of 80, that says nothing about whether it gets 500 searches a month or 500,000. For that, you need an actual keyword volume tool. Presenting Trends data without that context is misleading, even if it’s unintentional.
The fix is straightforward: always pair Google Trends data with a real search volume tool before making budget decisions. Use Trends for direction and timing, use a volume tool for scale and opportunity size, and be clear about which tool answered which question when you’re reporting findings to a team or a client.
Ignoring Time Range Settings
The default time range on Google Trends is usually the past twelve months, and a lot of people never change it. That default view can completely hide long-term seasonal patterns or make a genuinely stable topic look like it’s declining, simply because the graph is only showing a partial slice of a longer cycle.
Always check a keyword across at least two different time ranges before drawing a conclusion: the default short-term view and a longer five-year view. If the short-term graph shows a decline but the five-year view shows the exact same dip happening at the same point every single year, you’re looking at normal seasonality, not a genuine drop in interest. Confusing the two leads to bad decisions, like pulling budget from a channel right before its usual seasonal recovery.
Also remember that changing the time range resets the 0 to 100 scale to a new peak reference point, as covered earlier. This means the same keyword can look dramatically different depending on the window you select, so always note which range you’re viewing before comparing screenshots or sharing data with a team, otherwise you risk comparing two charts that aren’t actually measuring the same thing.
Not Cross Checking With Other Tools
Google Trends works best as one input in a larger research process, not as the sole source of truth for any major decision. Relying on it alone, without cross-referencing search volume tools, Search Console data, or even simple manual searches to see what’s currently ranking, leaves gaps that lead to bad calls.
A practical cross-check routine looks like this: use Google Trends to spot direction and timing, use a tool like Ahrefs, SEMrush, or even the free Google Ads Keyword Planner to confirm actual volume and competition, and manually search the term on Google to see what’s currently ranking and whether there’s a real content or product gap worth filling. Skipping any one of these three steps increases your odds of chasing a trend that looks good on paper but doesn’t convert into real traffic or sales.
This is also where having a proper tools stack for research and analysis matters. No single free tool, Google Trends included, gives you the full picture on its own. Treat it as the starting point of a research process, not the finish line, and you’ll avoid most of the strategic mistakes covered in this section.
Google Trends rewards the marketers who actually dig into the related queries panel, check the time range before drawing conclusions, and cross-reference the data instead of taking a single graph at face value. It’s a free tool, but the insight it gives you on timing, seasonality, and rising demand is something plenty of paid tools don’t do nearly as well. Used properly, alongside a real keyword volume tool and your own Search Console data, Google Trends becomes less of a curiosity and more of a genuine planning tool that shapes when you publish, when you spend, and what you build next.
Start small if this is new territory. Pick three core topics from your niche, pull their Trends data for the past two years, and map out where the seasonal peaks and breakout opportunities actually sit. That one exercise will tell you more about your next quarter’s content and campaign calendar than another round of generic keyword research ever could. If you want a more structured path through keyword research, seasonal planning, and the rest of the SEO process this fits into, the SEO learning hub is a good next stop, and for anyone building out a full digital marketing skill set from scratch, the Alpha Marketer Foundation Program covers this alongside the rest of the fundamentals.
Frequently Asked Questions
What is Google Trends used for?
Google Trends is a free tool from Google that shows how search interest in a specific term changes over time, region, and category. Marketers use it to spot rising topics, plan seasonal content and campaigns, compare keyword variations, and check regional demand before launching products or ads.
Is Google Trends data 100 percent accurate?
Google Trends data comes from a sampled portion of actual Google searches, not the full dataset, so it’s directionally reliable but not precise. It’s built to show relative patterns and trends over time rather than exact search counts, so treat it as a guide for timing and direction, not a source for absolute traffic numbers.
How often does Google Trends update its data?
For recent time ranges, like the past hour, day, or seven days, Google Trends updates close to real time. For longer historical ranges, the data is based on a fixed daily or weekly sample that doesn’t change once it’s been recorded, so short-term views refresh far more frequently than long-term views.
Can Google Trends show exact search volume numbers?
No, Google Trends never shows exact search volume figures. It shows a relative score from 0 to 100 based on the peak interest point within your selected time frame and location. For actual search volume numbers, use a dedicated keyword research tool like Google Ads Keyword Planner, Ahrefs, or SEMrush alongside Trends data.
What does “Breakout” mean on Google Trends?
A “Breakout” label appears next to a related query when its search interest has grown by more than 5000 percent within the selected time range compared to before. It signals a sudden, sharp rise in interest and is often one of the earliest warning signs of an emerging trend worth investigating further.
How far back does Google Trends data go?
Google Trends data goes back to 2004 for most search terms and regions. You can select custom date ranges anywhere from the past hour up to the full historical range, which makes it possible to check both real-time spikes and long-term, multi-year seasonal patterns for the same keyword.
Is Google Trends better than a keyword research tool for SEO?
Google Trends and dedicated keyword research tools serve different purposes, so neither fully replaces the other. Google Trends is stronger for spotting timing, seasonality, and rising interest early, while tools like Ahrefs or SEMrush are stronger for exact search volume, keyword difficulty, and competitive analysis. Most solid SEO workflows use both together.
Can I use Google Trends for local or regional marketing?
Yes, Google Trends supports filtering by country, state, and in many regions, city-level data through the “Interest by subregion” feature. This makes it genuinely useful for local businesses trying to understand where demand for a product or service is concentrated before planning local ad spend or content.
Why does the same keyword show different numbers on different days?
Because Google Trends pulls from a sampled dataset rather than the complete search index, small variations can appear between checks, especially for lower-volume terms. Additionally, changing the selected time range resets the 0 to 100 scale against a new peak reference point, which can make the same keyword appear to have different values.
How do I find trending topics before my competitors do?
Check the “Related queries” panel under any Google Trends search and look specifically for terms tagged “Breakout.” Cross-reference those terms against current search results to see if existing content is thin or outdated, and move quickly to publish something more thorough, since breakout windows often close fast once larger sites catch on.
Can Google Trends help with product launch timing?
Yes, checking multi-year Trends data for a product category before launch reveals when interest typically starts climbing each year, usually several weeks before the actual seasonal peak. Launching a campaign during that early climb window, rather than waiting until peak season, generally means lower competition and cheaper advertising costs.
Does Google Trends work for B2B marketing, not just consumer products?
Yes, B2B topics show seasonal and cyclical patterns tied to fiscal years, budget planning periods, and major industry events, even though these patterns are less obvious than consumer holiday spikes. Checking Google Trends for core B2B service terms often reveals predictable demand cycles worth planning content and campaigns around.