

Your email platform says the Diwali campaign made ₹2,10,000. Your founder asks whether email is actually worth the money. You open the dashboard, stare at that revenue number, and realise you have no idea if you can trust it. That’s usually the moment people start searching for how to measure email marketing ROI, and usually it happens right after somebody senior asks a question they can’t answer.
Here’s the annoying truth. The number inside your email tool is almost never the number you should report. Mailchimp, Klaviyo and Brevo are all happy to take credit for any sale that happens within a few days of an open or a click. Some of those buyers were already heading to checkout. Some “opened” the email because Apple’s Mail app loaded it in the background. And on the cost side, most people count the software bill and forget everything else, like the designer who built the template or the three hours a week spent writing subject lines.
So this guide goes through the whole thing slowly. We start with what ROI really is and the formula behind it, then build the tracking so the revenue figure is believable, then count the costs people skip, and then deal with the messy part, which is attribution. After that come three worked examples with real-looking numbers (a Shopify store, a B2B SaaS company and a one-person newsletter), a list of mistakes that keep showing up, and twelve FAQs. If you’re a student, a freelancer or a small business owner with a Google Sheet and no data team, everything here works with free tools.
One more thing before we start. Nobody gets this perfect. Big brands argue about email attribution in meetings that run an hour too long. The goal isn’t a number accurate to the rupee. The goal is a number honest enough that you can decide where the next ₹10,000 of budget should go.
What You Will Learn in This Guide
This guide is built so you can read it top to bottom or jump to the part that’s bugging you right now. Here’s what you’ll walk away with, in the order it shows up on the page, so you can skip ahead if you already know the basics.
- What email marketing ROI means, and why profit-based ROI tells a different story from revenue-based ROI
- A six-step process to measure email marketing ROI for any campaign, flow or newsletter
- Every cost that belongs in the formula, including the ones nobody remembers
- How to set up UTM tags, GA4 reports and promo codes so revenue tracking holds up
- How to handle Apple Mail Privacy Protection, last-click bias and holdout tests
- Metrics that sit next to ROI, like revenue per recipient and customer lifetime value
- Three worked examples with full calculations you can copy into a spreadsheet
- The mistakes that quietly wreck email reporting, plus how to improve the number once you have it
- Answers to 12 questions people keep asking about email ROI
How to Measure Email Marketing ROI: What the Term Actually Means
Email marketing ROI is the profit your email program earns compared with what it costs to run, shown as a percentage or a ratio. It answers one question: for every rupee or dollar we put into email, how much came back? Before any tools or dashboards, you need this definition locked in, because half of the confusion around email reporting comes from people using the same words for different things.
The Basic Email Marketing ROI Formula
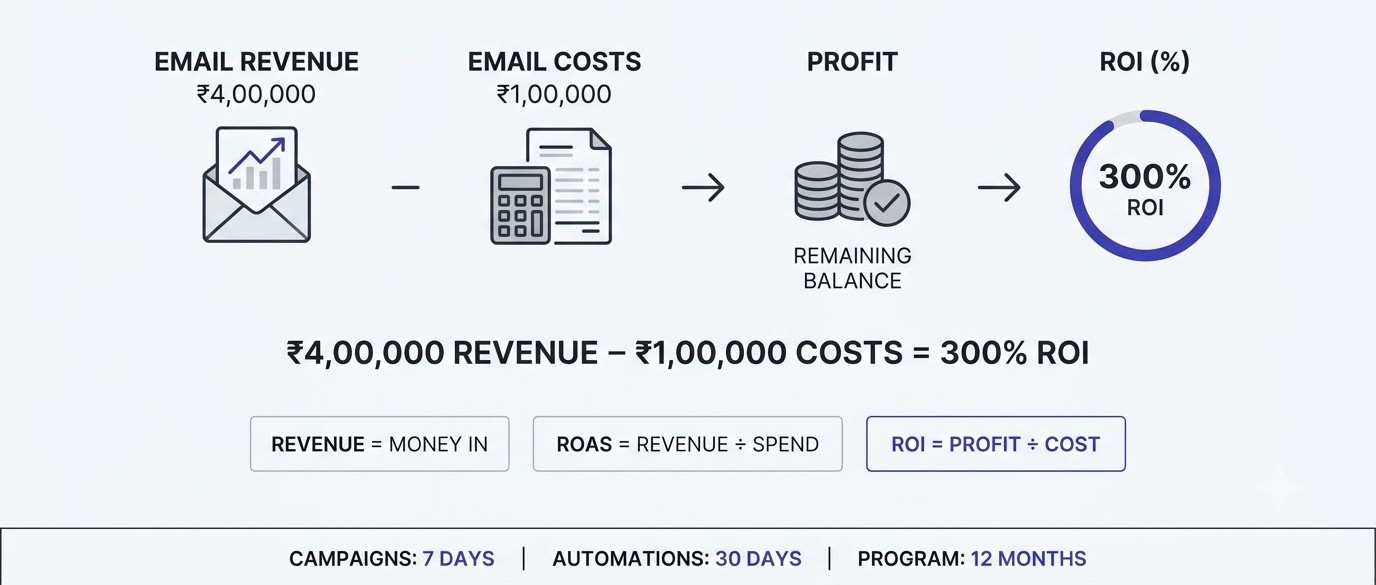
The formula is simple. ROI (%) equals (email revenue minus email costs) divided by email costs, multiplied by 100. Say a campaign brings in ₹4,00,000 and the total cost of running it is ₹1,00,000. That’s ₹3,00,000 of gain divided by ₹1,00,000 of cost, which gives 300%. In plain words, you got your money back and then three times that on top.
You’ll also hear people say “email returns 36 to 1”. That’s a ratio of revenue to spend, which is a different thing from ROI. A 4:1 revenue ratio equals 300% ROI, because ROI subtracts the cost you already spent. Pick one and label it clearly in every report, or somebody will quote the wrong one in a meeting.
ROI vs ROAS vs Revenue: Stop Mixing Them Up
Revenue is the total money that came in. ROAS (return on ad spend) is revenue divided by spend, usually used for paid ads. ROI is profit after cost, divided by cost. Same campaign, three different numbers, and each one answers a different question.
Why does this matter for email? Because email platforms love to show a big revenue figure, and a founder reading “₹2,10,000 attributed revenue” hears “₹2,10,000 profit”. It isn’t. A 40% margin product means that revenue is roughly ₹84,000 of gross profit before you subtract a single cost. Keep the three terms separate and your reports stop causing arguments.
Revenue-Based ROI vs Profit-Based ROI
Revenue-based ROI is quick and flatters you. Profit-based ROI is slower and tells the truth. To switch, multiply email revenue by your gross margin first. A skincare brand with ₹4,00,000 in email sales and a 40% gross margin has ₹1,60,000 in gross profit. Subtract ₹1,00,000 of costs and ROI falls from 300% to 60%.
That’s the same campaign, and the gap is huge. Neither number is wrong, but only one of them tells you whether the business made money. For internal decisions, use profit. For a quick sanity check on tests and subject lines, revenue-based is fine as long as everyone knows which one is on the slide.
Pick a Time Window Before You Calculate
A welcome email flow and a flash-sale blast don’t pay back on the same clock. The blast makes most of its money in 48 hours. The welcome flow keeps earning for months as new subscribers join. If you measure both over seven days, the flow looks weak and the blast looks like a hero, and you’ll make bad decisions about where to spend effort.
Set one window per type of email and keep it. A common setup: 7 days for promotional campaigns, 30 days for automated flows, and 12 months for your overall program. Whatever you choose, write it at the top of your sheet so next quarter’s numbers are comparable.
How to Measure Email Marketing ROI Step by Step
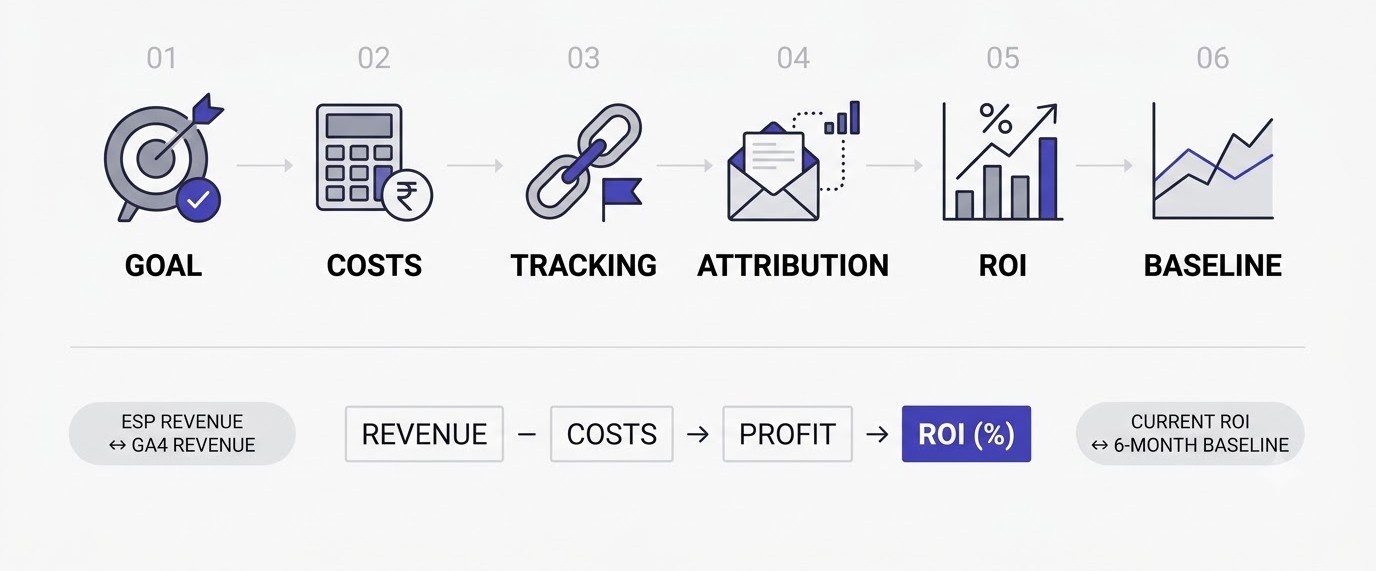
This is the process you can follow every month. It takes about an hour once the tracking is in place, and the first time you run it, you’ll probably find at least one thing that’s broken. That’s normal, and honestly it’s the best part, because broken tracking found today saves you from a bad budget decision next quarter.
Step 1: Decide What Counts as a Win
Start by writing down what a conversion means for your business. For a store, it’s a purchase. For a B2B SaaS company, it might be a demo booked or a trial started. For a newsletter, it could be a paid subscription or a sponsor slot sold. If you skip this step, you end up counting clicks as results and ROI turns into a vanity number.
Tie each goal to a money value. A demo that closes 20% of the time on a ₹1,50,000 deal is worth about ₹30,000 on average. That value is what you’ll use as email revenue later, so a rough number now beats a perfect number never.
Step 2: Add Up Every Cost
List every rupee spent on email in the period you picked. Software, freelancers, designers, discount codes, list tools and the hours your own team spent. The next big section covers this in detail, so for now just build the habit of listing costs in a column next to the revenue column.
The most common mistake here is stopping at the ESP invoice. A ₹4,000 monthly Mailchimp bill sounds like a bargain until you add a ₹25,000 retainer for the copywriter and 20 hours of your own time at ₹500 an hour. Same program, five times the real cost.
Step 3: Set Up Tracking Before You Send
Tracking has to be in place before the email goes out, because you can’t tag a link after people click it. Add UTM parameters to every link, connect your ESP to your store or CRM, and confirm GA4 is recording purchases. Run a test purchase using a link from a test email and check that it lands in the right report.
A lot of people skip the test purchase and discover three weeks later that nothing was recorded. Ten minutes of testing on a Monday saves a month of guessing. If your site setup feels shaky, the web development basics on the Learn hub cover analytics installation in plain language.
Step 4: Attribute Revenue to Email
Attribution means deciding which sales email gets credit for. Start with two numbers: what your ESP reports and what GA4 reports for the same period with source set to email. They will not match. ESP numbers are usually higher because they credit opens, GA4 usually credits only the last click.
Take GA4’s number as your floor and the ESP’s number as your ceiling. The truth sits between them, often closer to the floor. Later in this guide you’ll see how a holdout test can narrow that range into something you can defend.
Step 5: Run the Calculation
Now plug the numbers in. Take revenue (or gross profit), subtract total costs, divide by total costs, multiply by 100. Do it in a Google Sheet with one row per campaign or flow and a column each for revenue, margin, gross profit, cost, profit and ROI. Formulas keep it honest, and you can copy the sheet every month.
Calculate it twice, once with the ESP’s revenue figure and once with GA4’s. If both give a healthy ROI, relax. If only the ESP version looks good, you’ve just learned that your result depends on a generous attribution setting, which is worth knowing before you ask for more budget.
Step 6: Compare Against a Baseline
A single ROI number means nothing alone. Is 250% good? It depends on what you made last quarter, what your other channels return and what a similar email did last year. Build a simple baseline from your last six months and flag anything that lands more than 20% above or below it.
Compare email with other channels too, but carefully. Paid ads are often judged on immediate revenue while email builds an owned audience over time. The comparison is still useful, as long as you remember email’s costs are mostly fixed and its returns compound.
Costs You Must Count When You Measure Email Marketing ROI
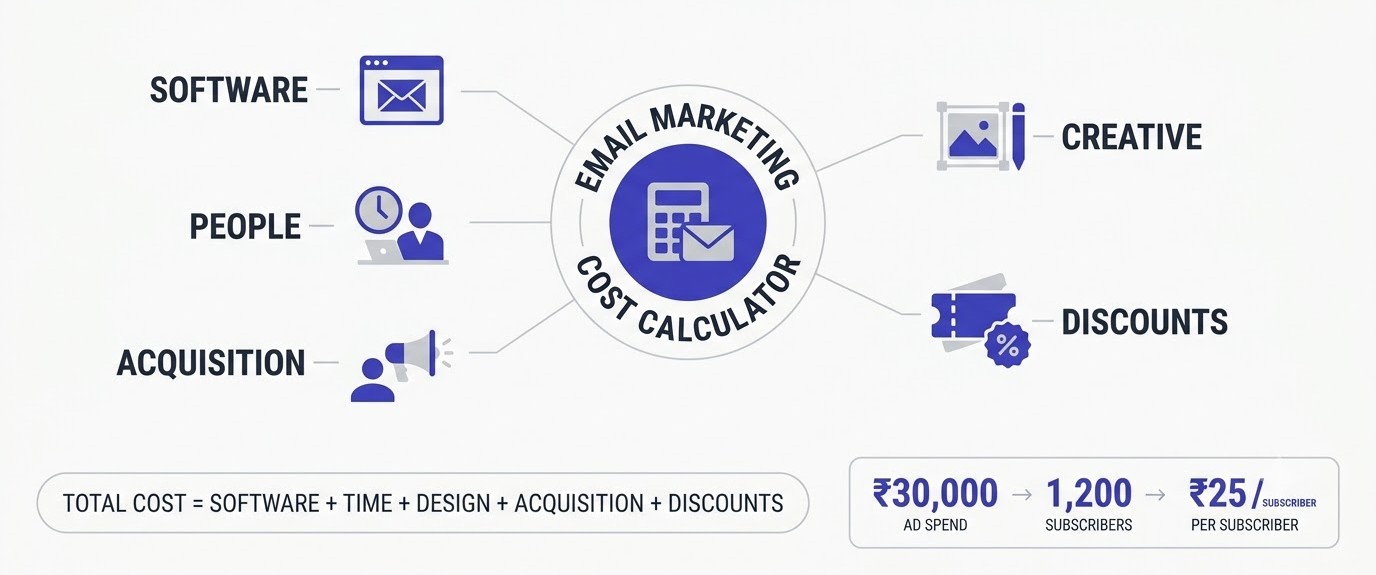
The cost side of the formula is where most reports go soft. People list the software bill, feel good about a huge ROI, and move on. A fair cost number includes everything you’d have to pay for if you hired someone else to run email for you. Think of it as a checklist you run through each month.
Software and Platform Fees
Start with the obvious one. Your email service provider (ESP) charges by list size or by emails sent, so the bill grows as you do. Mailchimp’s paid plans, Klaviyo, Brevo and ConvertKit all work this way. Add any extras too: a separate automation tool, a landing page builder, an SMS add-on or a tool that cleans your list.
Use the actual invoice, not the plan name. A Klaviyo account with 40,000 profiles can cost several times what you paid when you had 5,000, and nobody remembers to update the spreadsheet. Pull the number from your billing page each month and paste it in.
People and Time
Your own time costs money even if it never shows up on an invoice. If you spend six hours a week on email and your hourly value is ₹600, that’s ₹3,600 a week, or about ₹15,000 a month. Freelance copywriters, designers, developers and an email strategist on retainer go in the same row.
New marketers often leave this out because it feels strange to bill themselves. Do it anyway, even with a rough number. Otherwise a program that eats 30 hours a week and brings in ₹50,000 will look brilliant on paper while quietly being the worst use of your month.
Creative, Content and Design
Templates, custom illustrations, product photography used in emails, and copy all have a price. If you bought a Canva Pro seat, a stock photo subscription or paid a designer ₹8,000 to build a branded newsletter template, split that cost across the months you’ll use it. A template that lasts a year costs ₹667 a month, not ₹8,000 in one go.
For design basics that cut this cost, the graphic design tutorials on admeducation show how to build clean email visuals without paying a designer for every send. That’s one of the easiest costs to bring down once you can see it in the sheet.
List Building and Acquisition Costs
Subscribers don’t appear for free. Lead magnets, giveaways, paid social ads that point at a signup form, popup tools like Privy or OptiMonster, and webinar costs all belong here. If you spent ₹30,000 on Meta ads and got 1,200 new subscribers, each one cost ₹25 before you sent a single email.
There’s a debate about whether acquisition costs belong in email ROI or in the ad channel’s ROI. Honestly, either works as long as you pick one and don’t count the cost twice. For a clean view of email itself, many teams leave acquisition out and track it separately as cost per subscriber.
Discounts, Free Shipping and Incentives
This is the cost that sneaks by. If your welcome email offers 15% off and 500 people use it on ₹1,000 orders, you handed over ₹75,000 in margin. That’s real money leaving the business, even though no vendor ever sends you a bill for it.
Subtract discounts from revenue or add them to costs, but be consistent. A flash sale that looks like 400% ROI can drop under 100% once the markdown is counted. Many brands find their best-looking campaigns are really just ways of giving existing customers a coupon.
How to Measure Email Marketing ROI in GA4, Your ESP and Your Store
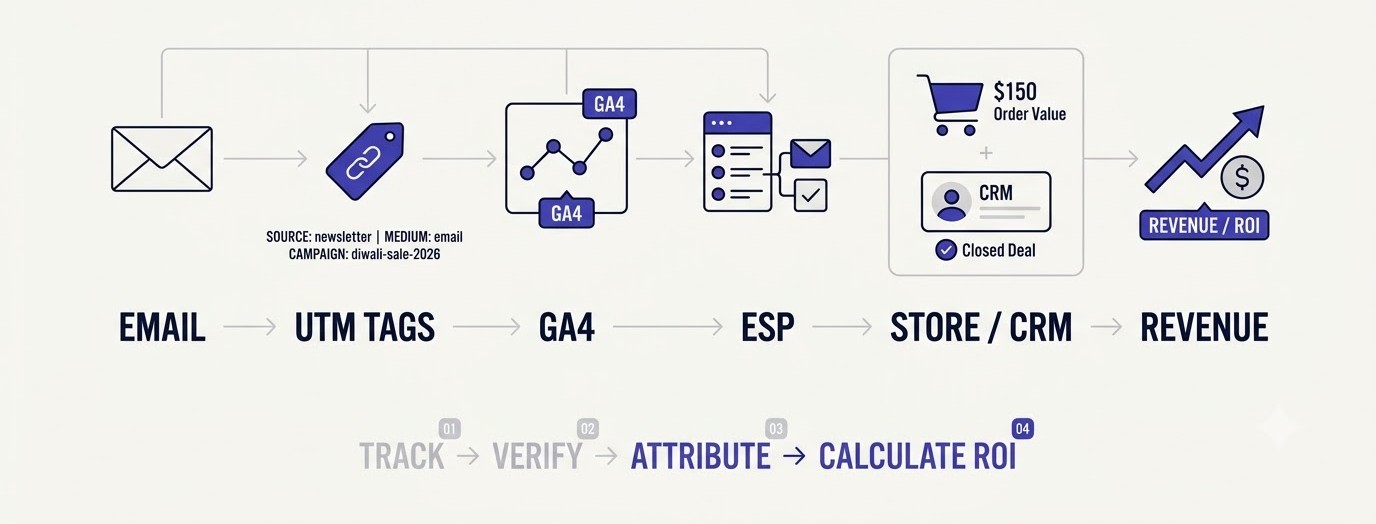
Good measurement is mostly plumbing. If the tags are wrong or the integrations are half connected, no formula will rescue your numbers. This section walks through the setup in the order it should happen, using tools most small teams already have: your ESP, Google Analytics 4 and a store platform or CRM.
Tag Every Link With UTM Parameters
UTM parameters are short bits of text added to a link so analytics tools know where a click came from. The four to use are utm_source (for example, newsletter or klaviyo), utm_medium (always email, lowercase), utm_campaign (a name like diwali-sale-2026) and utm_content (to tell two links in the same email apart).
The medium value matters more than people think. GA4 only puts traffic in its Email channel when the medium is email, so “Email” with a capital letter, or “e-newsletter”, can land your sales in the wrong bucket. Most ESPs can add UTMs automatically, but check one live link before trusting that setting. You can also build tagged links quickly with the free tools on admeducation rather than typing them by hand.
Read Email Revenue Inside GA4
In GA4, open Reports, then Acquisition, then Traffic acquisition. Change the primary dimension to Session medium, find the row labelled email and look at the Purchase revenue or Key events column. That’s what GA4 credits to email on a last-click style basis.
For more detail, use Explore and build a free-form report with Session campaign as the rows and Purchase revenue and Transactions as values. Now you can see which specific campaigns paid off. Set the date range to match the window you chose earlier, or the comparison with your ESP will be useless.
Connect Your ESP to Your Store
If you run a store, connect your ESP to it directly. Klaviyo’s Shopify integration, for example, passes order data back so each purchase can be tied to the email that came before it. Without that link, the ESP is guessing from clicks and has no idea what the cart was worth.
After connecting, run a test order and check three things: the order appears in the ESP, the revenue amount matches the store, and the right campaign gets the credit. Then compare one week of ESP revenue with the store’s own report for orders where the source was email. Gaps of 10 to 15% are normal. Gaps of 50% mean something is broken.
Use Promo Codes and Dedicated Landing Pages
Not every sale leaves a clean click trail. Someone reads your email on their phone, forgets, and buys on their laptop that evening. A unique promo code for each campaign, or a landing page used only in email, catches some of those sales that tracking misses.
Codes are a rough tool, since people share them and coupon sites scrape them. Still, they give you a second source of truth next to the ESP and GA4. If the code was used 180 times and GA4 only shows 90 email purchases, you know GA4 is under-counting and your real ROI is better than the floor suggested.
Tracking Email ROI for B2B and Lead Generation
B2B email rarely ends in a checkout. The email gets someone to download a guide, book a demo or reply, and the sale closes weeks later. To track this, push email source data into your CRM, such as HubSpot or Zoho, and keep it attached to the contact record all the way to a closed deal.
Then measure at the deal level. Of the 40 deals closed this quarter, how many contacts first came from email, and how many had email in the middle of the journey? Multiply those deals by average deal value and you have email revenue for a long sales cycle.
How to Measure Email Marketing ROI When Attribution Gets Messy
Here’s where it gets uncomfortable. Even with perfect tags, the data lies in specific, predictable ways. Opens are inflated, last-click ignores the earlier touches, and ESPs give themselves credit generously. None of this means you can’t measure ROI. It means you need to know which direction each number leans before you trust it.
Apple Mail Privacy Protection and the Open Rate Problem
Apple introduced Mail Privacy Protection in September 2021 with iOS 15. It preloads email content, including the tracking pixel, whether or not the person actually reads the message. So an “open” from an Apple Mail user can mean nothing more than their phone downloaded the email overnight.
The damage is real. Open rates went up across the board, and any ESP report that credits sales to opens now over-credits email. Stop using opens as a success measure. Look at clicks, click-to-purchase rate and revenue per recipient instead, since those can’t be faked by a background download.
Last-Click, Attribution Windows and ESP Over-Crediting
An attribution window is how long after a click or open the ESP will still claim a sale. In Klaviyo it’s often five days by default for email, though you should check your own account settings. Mailchimp, Brevo and others use their own windows. A longer window means bigger numbers and more credit for things email didn’t cause.
GA4 works differently. It generally credits the session that led to the purchase, so a shopper who clicked an email on Monday, then came back through a Google search on Thursday, gives the sale to organic search. Neither tool is wrong. They answer different questions, which is exactly why you compare them instead of picking the one you like.
Run a Holdout Test to Find Incremental Revenue
A holdout test is the closest thing to proof. Pick a campaign or flow, hold back 10% of the audience at random so they receive nothing, and send to the other 90%. After your chosen window, compare revenue per person in the two groups. The difference is the revenue email actually caused.
Example: the sent group makes ₹120 per recipient and the holdout makes ₹95 per person. Email’s true contribution is ₹25 per person, not ₹120. That’s a reality check some teams don’t enjoy, but it’s the number you can defend when someone asks if email works. Run one at least twice a year, since results change as your list changes.
Dealing With Overlap From Ads, SEO and Social
A customer rarely sees only email. They might see a Meta ad on Sunday, read your newsletter on Tuesday, search for your brand on Friday and buy. Which channel gets the credit? Depending on your tool, any of the three, and the totals across channels often add up to more than your actual sales.
You don’t need a perfect multi-touch model to handle this. Add up the revenue each channel claims, compare it with real revenue from your store, and note the overlap. If channels claim 140% of total sales, discount each claim by roughly a third when you report, and keep the same rule every month so trends stay comparable.
Metrics That Sit Next to Email Marketing ROI
ROI is the headline number, but it’s slow and it hides a lot. A single percentage can’t tell you if your list is shrinking, if Gmail is dumping you in spam, or if the same loyal 500 customers are carrying every campaign. These supporting metrics catch problems weeks before they show up in ROI.
Revenue Per Recipient
Revenue per recipient (RPR) is total campaign revenue divided by the number of people you sent to. If a campaign to 20,000 subscribers brings ₹2,40,000, RPR is ₹12. It’s the fairest way to compare a big blast with a tiny segment, because it adjusts for audience size and ignores inflated opens.
Use RPR to rank your campaigns. After a few months you’ll see patterns: product launches at ₹25 a head, newsletters at ₹3, abandoned cart emails at ₹40. Those gaps tell you where to spend your limited hours, and they make a much better conversation with your boss than “open rate went up 2%”.
Customer Lifetime Value From Email Subscribers
Customer lifetime value (CLV) is the total profit a customer brings over the entire time they buy from you. Email’s biggest contribution often isn’t the first sale, it’s the second, third and fourth. A subscriber who buys three times a year is worth far more than a one-off buyer from a paid ad.
Compare the average 12-month revenue of customers who joined your email list against customers who never did. In many stores, subscribers spend noticeably more. That gap is email’s long-term payoff, and a seven-day ROI window will never show it. Report it separately next to your campaign ROI.
List Growth, Churn and Unsubscribe Rate
Your list is the asset. Track net growth each month: new subscribers minus unsubscribes and bounced addresses. A healthy unsubscribe rate on a normal campaign sits well under 0.5%. If it jumps above 1% on a single send, the offer or the audience was wrong.
A shrinking list explains a lot of ROI slides that otherwise look mysterious. If revenue per send is flat but your list lost 8% last quarter, you’re making the same money from fewer people, which is arguably good news about engagement. The email marketing section on the Learn hub goes deeper on growing a list without buying addresses.
Deliverability and Spam Complaint Rate
Deliverability is the share of your emails that reach the inbox instead of spam. You can’t see it directly, but you can watch warning signs. Since early 2024, Google and Yahoo have asked bulk senders to keep spam complaints below 0.3%, and staying under 0.1% is the safer target. Google Postmaster Tools shows your domain reputation and spam rate for free.
If deliverability drops, ROI drops with it, but nothing in your revenue report will tell you why. Check Postmaster Tools monthly. Many ROI problems that look like “bad subject lines” are really inbox placement problems, and no amount of copywriting fixes those.
Click-to-Purchase Rate
Click-to-purchase rate is the share of people who clicked a link and then bought. If 1,000 people click and 30 buy, that’s 3%. It tells you whether the email promised something the landing page delivered. High clicks and low purchases usually mean a mismatch between the email and the page.
This metric also separates email problems from website problems. If clicks are strong but purchases are weak across every channel, fix the site. If only email clicks fail to convert, the problem sits in your email’s promise, targeting or the specific page you linked to.
How to Measure Email Marketing ROI: Three Worked Examples
Formulas make sense until you have to apply them to your own messy numbers. Here are three examples, each with different costs, margins and attribution. The figures are illustrative, built to show the method, so swap in your own and the logic will still work.
Example 1: A Shopify Skincare Store (30 Days)
A small skincare brand sends weekly campaigns and runs welcome and cart flows through Klaviyo. For one month, Klaviyo reports ₹6,20,000 in attributed revenue, while GA4 shows ₹3,90,000 under the email medium. Gross margin is 55%. Costs: Klaviyo ₹14,000, copywriter ₹30,000, designer ₹12,000, 40 hours of owner time at ₹500 (₹20,000) and ₹35,000 in discounts. Total: ₹1,11,000.
Using GA4 revenue: ₹3,90,000 times 55% gives ₹2,14,500 gross profit. Subtract costs and profit is ₹1,03,500, an ROI of 93%. Using Klaviyo’s revenue: ₹3,41,000 gross profit, ₹2,30,000 profit, ROI of 207%. Same month, same emails, and the answer swings by more than double. The honest report says “between 93% and 207%, probably nearer the low end”.
Example 2: A B2B SaaS Company (90 Days)
A software company emails 8,000 contacts a month with product tips and case stories. Over a quarter, six deals closed where email appeared in the contact’s history, each worth ₹1,80,000 in first-year contract value. Email was the first touch on two deals and a middle touch on four.
Credit the first-touch deals at 100% (₹3,60,000) and the middle-touch deals at 25% (₹1,80,000), for ₹5,40,000. At 80% gross margin that’s ₹4,32,000. Costs: marketing platform share ₹60,000, content writer ₹90,000, designer ₹15,000 and team time ₹45,000, which totals ₹2,10,000. Profit is ₹2,22,000 and ROI is about 106%.
Example 3: A One-Person Newsletter (Monthly)
A writer runs a weekly newsletter with 12,000 subscribers. Monthly income: two sponsor slots at ₹15,000 (₹30,000), 120 paid members at ₹250 (₹30,000) and ₹6,000 in affiliate commissions. Total revenue is ₹66,000, with almost no cost of goods, so margin is close to 100%.
Costs: email platform ₹8,000, freelance editor ₹12,000, ₹10,000 in ads to get new subscribers and 24 hours of the writer’s own time at ₹600 (₹14,400). Total is ₹44,400, leaving ₹21,600 profit and an ROI of 49%. Drop the writer’s time and ROI jumps to 120%. Which one is right? Both, but only the first tells the writer whether the newsletter beats a part-time job.
Mistakes That Quietly Ruin Your Email Marketing ROI Numbers
After you know how to measure email marketing ROI, the biggest risk is measuring it badly and believing the result. These mistakes show up in almost every account, from solo creators to teams with a dedicated analyst. Most are easy to fix once you’ve spotted them.
Trusting the ESP Dashboard Without a Second Source
Your ESP has a reason to look good. It credits opens, uses generous windows and rarely shows what would have happened without the email. Accepting its revenue number at face value is the single most common mistake in email reporting.
Fix it by checking every month’s ESP revenue against GA4 and, for stores, against the store’s own order report. You don’t have to pick a winner. Just report a range and explain why it exists, which also makes you look like the person who understands the data.
Leaving Out Hidden Costs
We covered this earlier, but it deserves a repeat because it’s so common. Ignoring your own time, freelancer fees and discounts can turn a 40% ROI into a 400% one on paper. Leadership then asks for more email, you can’t deliver, and the numbers come back to bite you.
Build the cost column once, as a fixed template, and refill it every month. After three months it takes five minutes, and nobody can accuse the report of cherry-picking.
Mixing Time Windows and Campaign Types
Comparing a seven-day blast with a 30-day flow, or a December sale with a quiet March newsletter, leads to nonsense conclusions. Seasonality alone can move results by 2x or more, especially around festivals and year-end.
Compare like with like. Look at November against last November, welcome flows against welcome flows. When you test something new, run it in the same week as the control so seasonality hits both equally.
Judging by One Campaign
One campaign can flop because of a bad subject line, a holiday, a server hiccup or just luck. One campaign can also win because you offered 30% off. Neither tells you much about the program as a whole.
Wait for at least three to five sends of the same type before declaring a pattern. Track a rolling 90-day ROI so single outliers fade into the average and real trends stand out.
Optimising for ROI Alone
If you chase ROI only, you’ll cut the welcome series that feeds the list, drop the educational emails that build trust and send discount after discount. ROI looks great for a quarter, then the list gets tired and unsubscribes pile up.
Keep ROI beside list growth, spam complaints and customer lifetime value. A program that earns 150% ROI while growing the list 3% a month beats one that earns 300% while shrinking it. Short-term efficiency can eat long-term revenue.
What to Do After You Measure Email Marketing ROI
Measurement is only worth the hour it takes if something changes afterwards. Once you’ve got a real number and a range, use it to decide what to do more of, what to stop and where the next rupee should go. Here are the moves that most often raise ROI without raising costs.
Fix Your Highest-Revenue Flows First
Automated flows like welcome series, abandoned cart and post-purchase emails usually earn more per recipient than one-off campaigns, because they reach people at exactly the right moment. Check yours first. A welcome flow that hasn’t changed in two years is probably leaving money on the table.
Rewrite one flow at a time and compare revenue per recipient before and after, over the same window. Small changes like moving the offer up, cutting the flow from seven emails to four or adding a reminder before the discount expires can lift results noticeably.
Segment Instead of Blasting
Sending the same email to everyone is the cheapest way to send and often the most expensive way to earn. A repeat buyer and a person who signed up yesterday need different messages. Even three simple segments, new subscribers, past buyers and inactive contacts, can lift revenue per recipient.
Start with behaviour, since it’s easier than demographics. Group people by what they clicked, what they bought and how long ago. Then change the offer, the tone and the frequency for each group, and measure each one against your baseline.
Clean the List and Cut Dead Weight
If 40% of your list hasn’t opened or clicked anything in six months, you’re paying for contacts who cost money and drag down your reputation. Run a re-engagement series, then remove the people who still don’t respond.
Your ESP bill drops, your engagement rate rises and Gmail sees you as a sender people actually want. A smaller, healthier list often earns the same revenue at a lower cost, which lifts ROI on both sides of the formula.
Test Offers, Not Just Subject Lines
Subject line tests make for neat screenshots and small gains. Testing the offer, the send time, the audience or the price point moves revenue much more. Free shipping versus 10% off can change the result by 20% or more for the same email.
Conclusion
Learning how to measure email marketing ROI comes down to a few habits: count all the costs, tag every link, compare at least two revenue sources and report a range instead of a single flattering figure. Add a holdout test once or twice a year and you’ll know what email truly earns for your business, not just what a dashboard claims.
Here’s what to do this week. Open a Google Sheet, list last month’s email costs in one column and GA4’s email revenue in the next, and calculate profit-based ROI. It’ll take under an hour, it won’t be perfect, and it’ll be more honest than what you have now.
Frequently Asked Questions
What is a good ROI for email marketing?
There’s no single number, because margins and costs vary by business. As a rough guide, a profit-based ROI above 100% means email pays for itself and then some. Revenue-based figures look much bigger, with Litmus reporting averages around $36 back for every $1 spent, but those averages usually ignore people costs and discounts.
How do you calculate email marketing ROI?
Subtract your total email costs from your email revenue, divide the result by your total costs, then multiply by 100. For a more accurate answer, use gross profit instead of revenue. For example, ₹1,60,000 in gross profit against ₹1,00,000 in costs gives an ROI of 60%.
What is the average ROI of email marketing?
Industry surveys often quote returns between $36 and $42 for each $1 spent. Treat those as revenue ratios from self-reported data, not guaranteed results. Your own number depends on your margin, list quality and how many costs you count.
How often should you measure email marketing ROI?
Track campaign-level revenue per recipient weekly and calculate full ROI monthly. Do a deeper review every quarter, including a holdout test once or twice a year. Measuring more often than that mostly produces noise, especially for small lists.
Can you measure email marketing ROI without an online store?
Yes. Define a conversion that has a money value, such as a demo booked, a paid subscription or a sponsor slot sold. Track it with UTM links and a CRM or spreadsheet, then assign an average value to each conversion and use it as email revenue in the formula.
Which tool is best to measure email marketing ROI?
No single tool does it all. Use your ESP (Klaviyo, Mailchimp, Brevo) for campaign data, GA4 for an independent view of sessions and purchases, and a Google Sheet to combine everything with costs. For B2B, add a CRM like HubSpot to follow leads through to closed deals.
Why is my ESP revenue higher than GA4?
ESPs usually credit sales after opens and use longer attribution windows, while GA4 tends to credit only the session that led to the purchase. Apple Mail Privacy Protection also inflates opens, which can push ESP numbers higher. Treat GA4 as your floor and the ESP as your ceiling.
Are open rates still useful for measuring email performance?
Open rates are a weak signal since Apple’s Mail Privacy Protection launched in 2021 and began preloading emails. They can still help compare two versions of a subject line within the same audience. For ROI, rely on clicks, conversions and revenue per recipient.
How do you measure the ROI of an email newsletter?
Add up everything the newsletter earns, including sponsorships, paid memberships, affiliate links and product sales. Subtract the costs of the platform, editing, design, subscriber acquisition and your own time. Divide by those costs and multiply by 100 to get ROI.
What is the difference between email ROI and ROAS?
ROAS divides revenue by spend, so ₹4,00,000 of revenue on ₹1,00,000 of spend gives a ROAS of 4. ROI subtracts costs first, so the same example gives 300%. ROAS is common in paid ads, while ROI gives a clearer view of profit.
How long does it take to see a return from email marketing?
Promotional campaigns pay back within days, while automated flows and newsletters often take two to four months to pay for themselves as the list grows. Building an engaged list takes time, so judge email on a 90-day or 12-month view rather than a single week.
Should you include your own time in email marketing costs?
Yes, at a realistic hourly rate. Leaving it out makes small programs look far better than they are, especially for solo marketers and founders. If it feels awkward, show ROI both ways, with and without your time, so readers see the full picture.
What is a holdout test in email marketing?
A holdout test keeps a random slice of your audience, often 10%, from receiving a campaign or flow. After the test window, you compare revenue per person between the group that received email and the group that didn’t. The difference is the revenue email actually caused.