

Open Meta Ads Manager on the first of the month and it says 120 purchases. Google Ads says 140. Your email tool says 90. Add them up and you get 350 sales, but the Shopify dashboard shows 210 orders. Nobody is lying. Every tool is just using its own rule for deciding who gets the credit, and arguing about those rules is what a lot of marketing meetings quietly turn into.
Marketing attribution models explained in one line: they are the rules that decide which touchpoint gets credit when someone buys, signs up or books a call. First click gives all the credit to the very first touch. Last click gives it all to the final one. Linear splits it evenly across everything in between. Three rules, three completely different stories about the exact same customer.
And the story you pick changes where the money goes. Picture a D2C skincare brand spending ₹2 lakh a month on Instagram ads. Under last click reporting, those ads look terrible, because people rarely buy straight from the ad. They see it, forget it, Google the brand a week later and buy. So the founder cuts Instagram, and three weeks later branded search traffic falls off a cliff. The channel that started the journeys got killed because the report never gave it credit.
This guide walks through the whole thing the way it plays out on real ad accounts. You will see what attribution means without the jargon, how first click and last click work and where each one lies to you, how linear and the other multi-touch models compare, a worked example with real rupee numbers, and how to set up tracking in Google Analytics 4 so the data is not garbage. It is written for students and small business owners as much as working marketers, so every term gets explained the first time it shows up.
What You Will Learn in This Guide
Here is the short list of what is coming, so you can jump straight to the part you care about. Each point below matches a section of the article, and none of it needs a data science background or a paid tool.
- What attribution actually means, and why every dashboard shows a different number for the same sale
- How first click attribution works, when it helps and where it misleads
- How last click attribution works, why it became the default and what it hides
- How linear attribution splits credit, plus time decay, position-based and data-driven models
- A side-by-side worked example showing one ₹4,000 order credited four different ways
- How to pick a model for your business and set up tracking in GA4, UTMs and ad platforms
- The mistakes that wreck attribution data, and 12 questions people keep asking
TL;DR
- An attribution model is a rule for splitting credit for a sale across the touchpoints a customer went through.
- First click rewards whatever introduced the customer, last click rewards whatever closed the sale, and linear gives every touch an equal share.
- Last click makes branded search, retargeting and email look better than they are, while starving the channels that create demand.
- Short buying cycles can live with last click, but anything longer than a few days needs at least two models compared side by side.
- Clean UTM tagging and consistent conversion tracking matter more than which model you choose.
Marketing Attribution Models Explained: What Attribution Is and Why Teams Fight About It
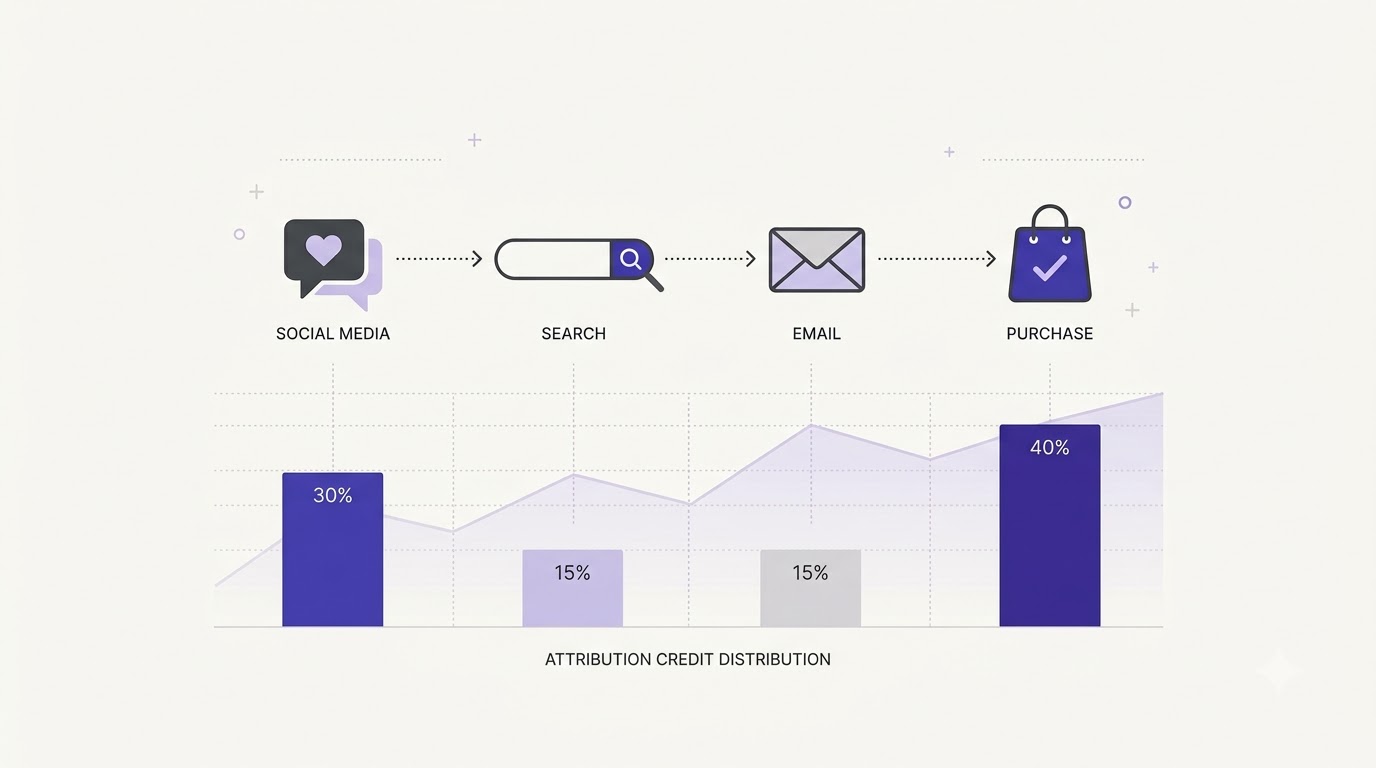
Attribution is the process of deciding which marketing touchpoint deserves credit for a conversion. That is the whole idea. This section covers the vocabulary, the reason every dashboard disagrees with every other dashboard, and the split between rule-based and data-driven models, so the three main models later on make sense without any guesswork.
What Attribution Means in Plain Words
Attribution is bookkeeping for marketing. A customer pays ₹3,800 for a pair of sneakers, and the question is which of your efforts earned that money. The Instagram reel that introduced the brand? The Google search that brought them to the product page? The abandoned cart email that pulled them back? Attribution assigns the credit, and an attribution model is the rule used to split it.
Without a rule, the argument runs on gut feeling. The founder swears by Instagram, the performance marketer swears by Google Ads, and the email person points at a 38% open rate. A model turns the argument into numbers, which is better, but only if everyone understands the rule sitting behind those numbers.
Here is the thing most beginners miss. No model is the truth. Every model is a simplification of a messy human decision. Some days the simplification is close enough. Other days it points you in the wrong direction, and knowing which is which is the actual skill.
Touchpoints, Conversions and the Customer Journey
A touchpoint is any interaction a person has with your brand before buying: a paid ad, an organic Google result, a WhatsApp message, a newsletter, a YouTube video, a visit typed straight into the browser. A conversion is the action you care about, like a purchase, a lead form or a free trial. The customer journey is the chain of touchpoints between the first one and the conversion.
Journeys are longer than most people expect. For a ₹499 phone case, the path might be two touches over one evening. For a ₹60,000 online course or a B2B software demo, it can be 8 to 15 touches over several weeks, across a phone, a laptop and a work computer. Longer journeys are exactly where the choice of model starts to matter.
Each tool records this chain differently. GA4 stitches sessions together using cookies and signed-in Google accounts. Meta uses its own logged-in users. Your email platform only sees clicks on its own links. So the journey you see depends on who is recording it, which leads straight into the next problem.
Why Every Platform Reports Different Numbers
Meta’s default attribution setting counts a purchase if someone clicked your ad within 7 days or just viewed it within 1 day. Google Ads counts activity on its own ads and takes the credit. GA4 looks across channels and applies its own rules. Shopify leans on last click in its sales reports. Four tools, four rulebooks, one order.
Then the technical holes pile up. Since Apple rolled out App Tracking Transparency with iOS 14.5 in 2021, a big slice of iPhone users stopped being trackable across apps. Ad blockers drop tracking scripts. People see an ad on a phone and buy on a laptop. Each gap makes some touches invisible, and the invisible ones usually belong to upper-funnel channels like video and social.
So stop expecting platform numbers to add up to your real order count. They will not. The practical move is to pick one source of truth for money (usually the store backend or the CRM), one tool for cross-channel journeys (usually GA4), and treat each ad platform’s own report as a rough view of that platform only.
Rule-Based Models vs Data-Driven Models
Rule-based models follow a fixed formula. First click, last click, linear, time decay and position-based all fit here. You can predict exactly how credit will be split before any data arrives, which makes them easy to understand and easy to explain to a boss or a client.
Data-driven models use machine learning on your actual conversion paths. They compare journeys that ended in a sale with similar journeys that did not, then work out how much each touchpoint changed the odds. GA4 uses data-driven attribution as its default for this reason. The catch is volume: with only a handful of conversions a month, there is not enough signal for the math to be stable.
In 2023, Google removed first click, linear, time decay and position-based from GA4 and Google Ads reporting, leaving last click and data-driven as the main options there. That is exactly why the older models still deserve attention. They live on in other tools, in spreadsheets, and in how sharp marketers think about credit even when the dashboard will not show it. If channels, funnels and ad platforms still feel fuzzy, the digital marketing basics section of the Learn hub is a good place to fill those gaps before going deeper.
First Click vs Last Click Attribution: Two Opposite Ways of Giving Credit
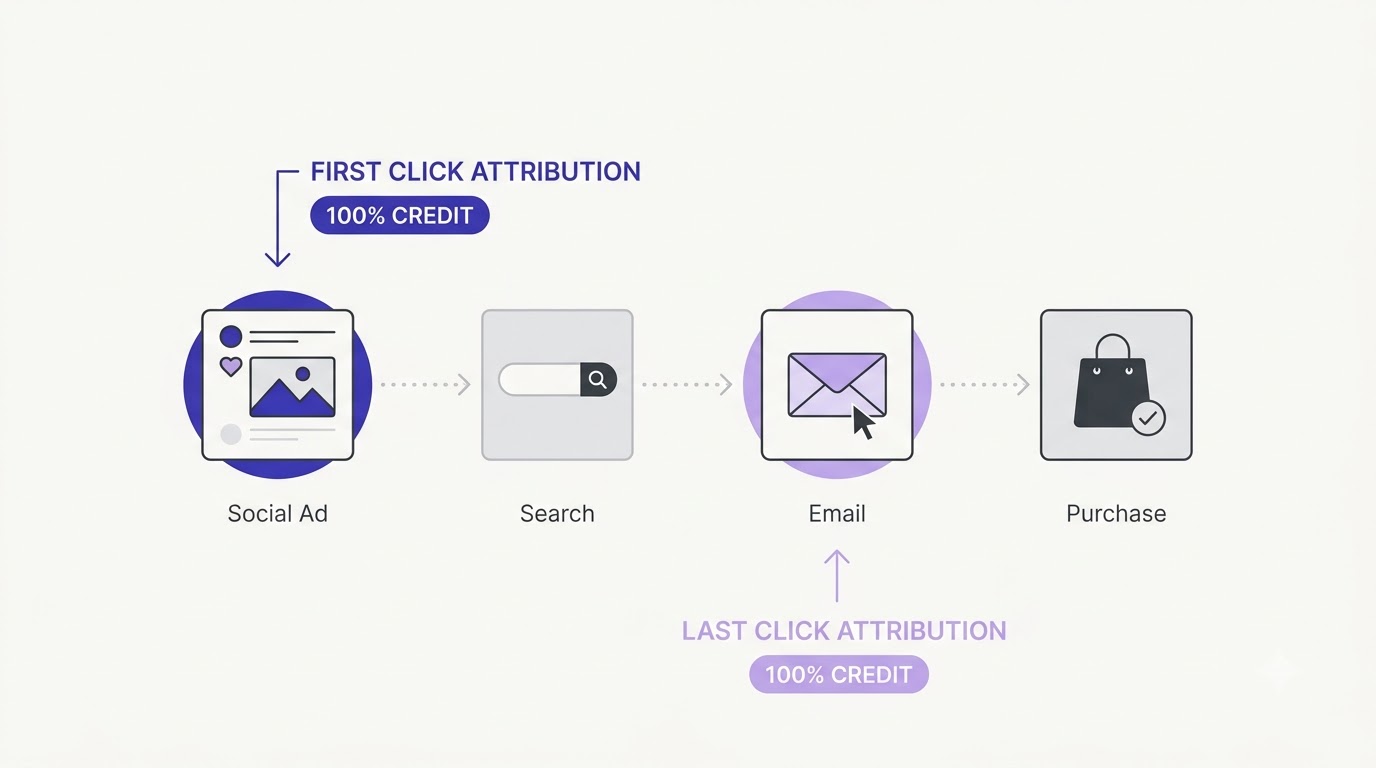
First click and last click sit at opposite ends of the journey. One rewards the touch that introduced the customer, the other rewards the touch that closed the sale. Each part below covers how the model works, where it earns its keep, and the specific way it will mislead you if you trust it blindly.
How First Click Attribution Works
First click attribution gives 100% of the conversion credit to the first touchpoint in the journey. If a customer first discovered you through a YouTube ad, then visited via Google search, then clicked an email and bought, YouTube gets the full ₹4,000 and everything after gets zero. Simple rule, zero ambiguity.
Technically, the tool reads the earliest recorded interaction inside the lookback window. That is the stretch of time it searches backward from the conversion, commonly 30 or 90 days. If the real first touch happened 100 days ago, the model never sees it, so a short window quietly pushes credit toward channels that show up later in the journey.
The logic behind the model is that without discovery, nothing else happens. Fair point. Nobody searches for a brand they have never heard of. That belief is why first click is the favorite of brand and awareness teams.
When First Click Attribution Is the Right Lens
First click fits when the real question is where new customers come from. A young brand with a small audience, launching in a new city, wants to know which channel puts strangers into the funnel. First click answers that cleanly, because it ignores everything that happens after the introduction.
It also helps with budget calls on top-of-funnel spend. Say a ₹1.5 lakh monthly budget is split across Instagram reels, YouTube pre-roll and a podcast sponsorship. A first click view shows which one produces the most customers whose first-ever visit came from it, instead of which one happened to grab the final click.
Content teams get value here as well. Blog posts rarely close sales directly. Under first click, a post that introduced 300 future buyers finally shows up as a winner instead of looking like a traffic vanity project.
Where First Click Attribution Misleads You
The weak spot is obvious once you say it out loud: it ignores everything between hello and buy. A customer who found you through a random Facebook post, then spent two weeks comparing you to competitors, then got won over by a retargeting ad and a discount email, still credits Facebook 100%.
It also over-rewards cheap, broad discovery. Channels that bring lots of low-intent visitors, like giveaway posts or viral memes, can look amazing because they collect a huge number of first touches. Whether those people ever become customers depends on everything after, which first click refuses to look at.
And the data is shaky for a technical reason. First touches are the ones most likely to vanish, because a cookie set weeks ago gets deleted, or the person switched devices. So the model credits whatever first touch it can still see, which may not be the true first touch at all.
How Last Click Attribution Works
Last click gives 100% of the credit to the final touchpoint before conversion. Same journey as before, YouTube then Google then email: the email gets ₹4,000 and everything earlier gets nothing. It is the mirror image of first click.
GA4 also has a variation called last non-direct click, which skips direct visits (typing the URL, using a bookmark) and credits the last channel the person actually came through. Many older reports work this way, because otherwise Direct would swallow a huge share of sales.
The reasoning is straightforward: the last touch is what finally pushed the person over the line. If someone bought right after clicking, that click mattered. It is also the easiest model to calculate, and its data is the most reliable, since the final touch usually happens in a recent session with a fresh cookie.
Why Last Click Became the Default Everywhere
Early ad platforms were built around the click. A click is measurable, it carries a cost, and it happens right before an action, so counting the last one was the easiest thing to build. Decades of reports, bonus structures and agency retainers got stacked on top of that choice.
It also feels fair to people who pay for performance. When a Google Ads manager says this campaign got 60 sales at ₹450 each, last click makes the claim easy to defend and easy to check against the platform.
Honestly, it survives because it is convenient. Simple to explain, simple to audit, and it rewards the channels that capture demand that already exists. For a business selling a ₹300 product with a one-day buying cycle, that is often accurate enough.
The Biggest Problem With Last Click: Branded Search Takes the Trophy
Here is where last click does real damage. Somebody sees your Instagram ad, remembers the brand name, and later types it into Google. They click your branded search ad and buy. Last click hands the entire sale to branded search, which now looks like a miracle channel with a 12x ROAS (return on ad spend, meaning revenue divided by ad cost), while Instagram looks like a money pit.
That branded search return is mostly an illusion. Those people were already coming. The ad just stood at the finish line. Cut Instagram because the report said so, and branded search volume shrinks within weeks, because nothing is feeding the demand anymore.
Retargeting and email tend to collect the same unearned halo, since they often reach people who were already about to buy. Anyone who has managed ad accounts for a few years has watched this happen at least once, and the case studies section collects more real campaign breakdowns showing what happens to results when budgets move.
First Click vs Last Click: Which One Should You Trust?
Neither, alone. Used together they work like a pair of bookends. First click tells you where customers start, last click tells you what finishes the job, and the gap between the two numbers for the same channel is the interesting part. A channel with strong first click and weak last click is an introducer. A channel with the opposite pattern is a closer.
A useful habit: pull both views for the same 30 days and put them in one sheet. If YouTube shows 80 first click conversions and 6 last click conversions, cutting it because of the 6 would be a bad call. If branded search shows 400 last click conversions and 15 first click, it is mostly collecting demand that someone else created.
Opinion time: for any business with a buying cycle longer than a few days, last click alone is the most expensive default in marketing. It feels precise, and it is precise, just about the wrong question.
Linear Attribution and Other Multi-Touch Marketing Attribution Models
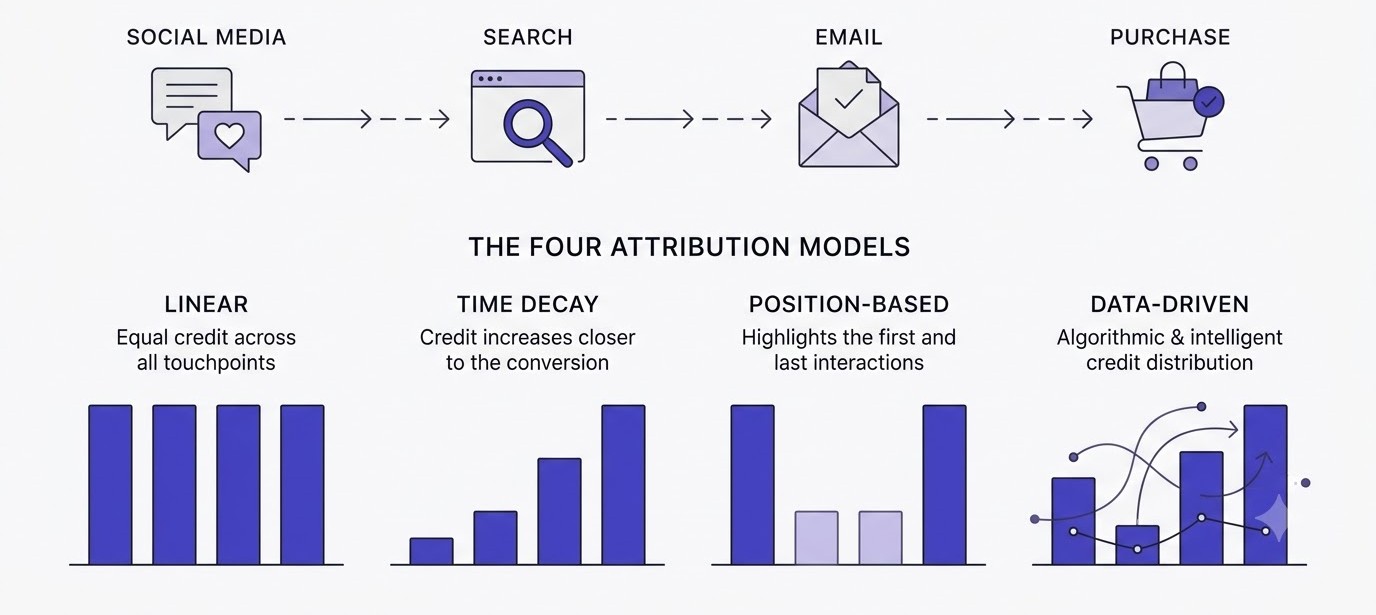
Linear attribution splits credit evenly, but it is only one of several multi-touch models. This part explains linear first, then time decay, position-based and data-driven, with the situation each one fits and the weak spot it brings along, so the comparison table later makes sense.
How Linear Attribution Works
Linear attribution divides the conversion credit equally across every touchpoint in the journey. Four touches on a ₹4,000 order means ₹1,000 each. Seven touches means about ₹571 each. Nobody wins big, and nobody gets ignored.
The appeal is fairness, and it is usually the first model people grab after getting burned by last click. It also forces one useful habit: you have to look at the full path instead of only the two endpoints. HubSpot and Adobe Analytics still offer it as a built-in option, and it is easy to rebuild in a spreadsheet if your tool does not.
Since GA4 dropped it, many teams only meet linear inside CRMs and reporting tools that tie ad touches to deals. That is actually where it fits best, because B2B journeys with many touches and many people involved are the exact scenario it was built for.
When Linear Attribution Makes Sense
Linear works when the buying decision is slow and no single touch clearly deserves the hero role. Take a private college selling a ₹1.2 lakh diploma. A student sees a Meta ad, attends a webinar, reads the brochure, gets a call from a counselor and finally pays the fee. Which touch did the work? Honestly, all of them did a bit.
It also helps when a team keeps fighting over credit. Paid, SEO and email people each insist their channel was the reason for the sale. Linear gives everyone a neutral starting point, and the conversation shifts from who gets the trophy to which channels show up in winning journeys at all.
That second use is underrated. Even if linear is never the model you report to the boss, running it once tells you which channels appear in journeys that convert. A channel that shows up in 40% of winning paths but never gets last click credit is a channel you probably should not cut.
Where Linear Attribution Falls Short
The obvious flaw is that it treats all touches as equal, and they are not. A three-second banner impression and a 40-minute product demo get the same slice. A person scrolling past an ad gets the same credit as a person who read your pricing page twice.
It also rewards frequency. If a retargeting campaign hits the same person 12 times in a week, that channel collects 12 shares. Spend more on retargeting and your linear numbers improve, even though nothing new was created. The model confuses repetition with contribution.
The last problem is dilution. With ten touches, each one gets 10%, so every channel looks average. That sounds fair, but it leaves you with no clear direction. A report where everything looks the same does not tell you what to change on Monday morning.
Time Decay Attribution Explained
Time decay gives more credit to touches closer to the conversion, using a half-life. With a 7-day half-life, a touch that happened a week before the sale gets half the weight of a touch on the day of purchase. Older versions of Google Analytics and Google Ads used 7 days as the standard setting.
It fits short-cycle situations well: a 5-day Diwali sale, a product launch, or a lead-gen funnel that closes in two to three weeks. In those cases, recent touches really do matter more, and the model matches how people behave.
The weakness is that discovery gets crushed. A brand introduction that happened 30 days ago ends up with close to zero credit. So time decay is really last click wearing a softer jacket, and it carries the same bias against top-of-funnel channels, just less extreme.
Position-Based (U-Shaped) Attribution
Position-based attribution, also called U-shaped, gives 40% of the credit to the first touch, 40% to the last touch and splits the remaining 20% across everything in the middle. The thinking: the first touch creates awareness, the last one closes, and the middle touches keep the person warm.
There is also a W-shaped version used in HubSpot, which adds a third peak at the moment a lead is created. For B2B teams with a clear lead stage in the CRM, that extra anchor makes a lot of sense, since the journey really does have three big moments: first visit, form fill and deal creation.
Here is the catch. The 40/20/20/20 weights are a human opinion, not a measurement. Nothing proves the first and last touches deserve exactly 40 each. It is a sensible compromise between first click and linear, and that is all it is.
Data-Driven Attribution: The Model Google Pushes
Data-driven attribution uses machine learning on your own conversion data to estimate how much each touchpoint changed the chance of a sale. GA4 uses it by default, and Google Ads does too. There are no fixed weights. The model decides based on patterns in real paths.
The upside is obvious: it adapts to your business instead of forcing a formula onto it. The downsides are real, though. It is a black box, so you cannot see exactly why a channel got its share. It needs enough conversions to learn from. And inside Google’s tools it mostly sees Google inventory plus whatever GA4 can track, so views on Meta or TikTok may be missing.
Use it as one input, not as gospel. When data-driven and last click disagree wildly about a channel, treat that gap as a question worth investigating, not as an answer that settles anything.
Marketing Attribution Models Explained Side by Side With a Worked Example
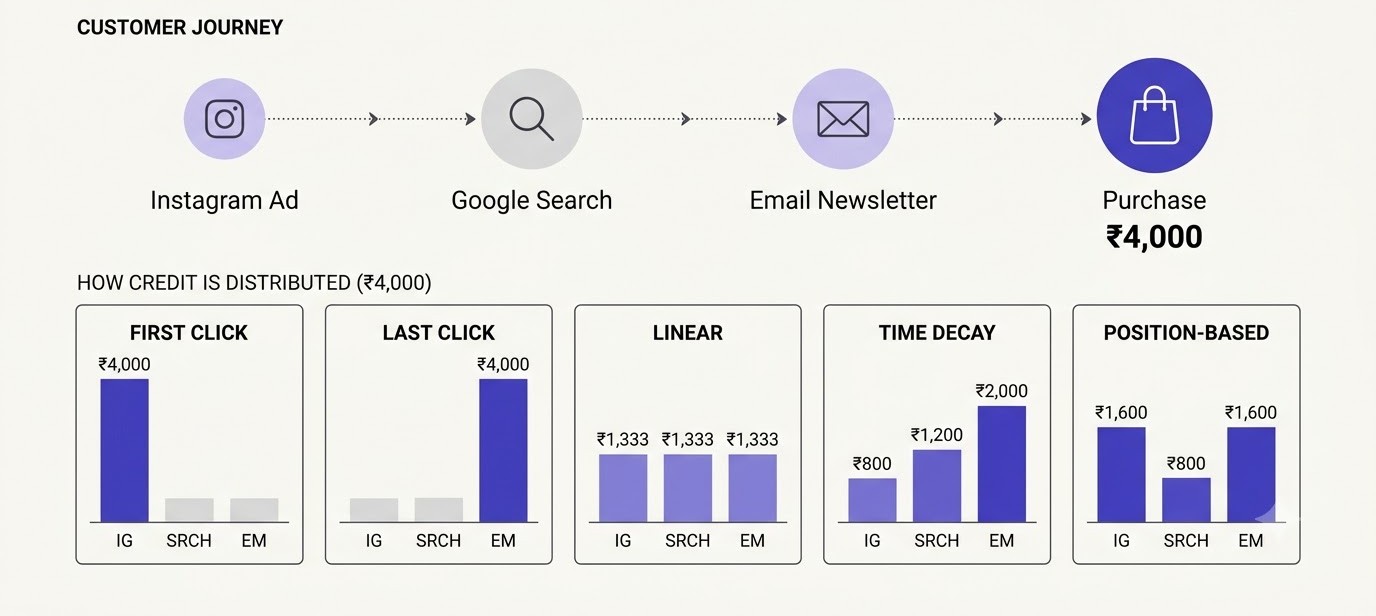
Theory only goes so far, so this section runs one single customer journey through every model and then scales it up to a month of spend. Same order, same four touches, completely different winners. Once you see the numbers move, the differences between models stop being abstract.
The Customer Journey We Will Use
Meet Riya, who orders a ₹4,000 skincare set from a D2C brand. Day 1: she sees an Instagram ad (paid social) while scrolling and clicks through but does not buy. Day 4: she Googles a question about her skin type and lands on the brand’s blog post through organic search.
Day 8: she opens the brand’s email newsletter, which she signed up for on the blog, and clicks the 10% off link. Day 10: she searches the brand name directly on Google, clicks the branded search ad and completes the purchase. Four touches, ten days, one ₹4,000 order.
This is not a strange path. If anything, it is a tidy one. Real journeys have more touches, more devices and more direct visits mixed in. But four touches are enough to show how each rule behaves, and the math stays easy to follow.
How Each Model Credits That Order
The table below shows exactly how ₹4,000 gets divided under each model. Time decay values are rounded, using a 7-day half-life measured back from the day of purchase.
| Touchpoint | First Click | Last Click | Linear | Time Decay | Position-Based |
|---|---|---|---|---|---|
| Day 1: Instagram ad | ₹4,000 | ₹0 | ₹1,000 | ₹590 | ₹1,600 |
| Day 4: Blog via organic search | ₹0 | ₹0 | ₹1,000 | ₹794 | ₹800 |
| Day 8: Email newsletter | ₹0 | ₹0 | ₹1,000 | ₹1,179 | ₹800 |
| Day 10: Branded search ad | ₹0 | ₹4,000 | ₹1,000 | ₹1,437 | ₹1,600 |
Look at what happens to the Instagram ad. It earns the whole order under first click, nothing under last click, a quarter under linear and 40% under position-based. Same ad, same customer, same afternoon. The only thing that changed was the rule.
What the Numbers Actually Tell You
First click says Instagram is the star and everything else is noise. Last click says branded search is the star and Instagram is a waste. Both statements come from the same data, so both cannot be the full truth. The honest reading is that Instagram started the story and branded search ended it, and either one removed would likely have broken the sale.
Linear and position-based land closer to that reality because they spread credit across the path. Notice that the blog post and the email never win under any single-touch model. They only matter in multi-touch views. That is why content and email teams so often get their budgets cut: single-touch models make them invisible.
Time decay lands in the middle but leans toward the end of the path. It tells you branded search and email were close to the money, and says very little about what started the process. If you only looked at that column, you would underfund discovery without ever noticing.
Scaling the Example to a Month of Spend
Now pretend 100 journeys like Riya’s happened in one month. Revenue is ₹4,00,000. Instagram spend was ₹80,000 and branded search spend was ₹20,000. This is a made-up illustration, but the pattern matches what many accounts really look like.
Under last click, Instagram shows ₹0 revenue on ₹80,000 spend, a ROAS of 0, while branded search shows ₹4,00,000 on ₹20,000, a ROAS of 20. Under first click it flips: Instagram gets a ROAS of 5 and branded search gets 0. Under linear, Instagram sits at 1.25 and branded search at 5.
Three reports, three budget decisions. Last click says move everything to branded search, which would collapse because there is nothing left to search for. First click says cut branded search, which would be fine until competitors bid on your brand name. The linear view, boring as it looks, is the least likely to wreck anything. If you want to rebuild this kind of calculation yourself, the free marketing tools on the Academy’s tools site are worth a look for speeding up the spreadsheet work.
How to Choose and Set Up the Right Marketing Attribution Model
Picking a model is half the job. The other half is making sure the data going into it is clean. This section covers how to choose based on your buying cycle and your question, then walks through the UTM, GA4 and cross-checking steps that make any model more trustworthy.
Start With Your Buying Cycle
The length of your sales cycle matters more than any other factor. Under three days, such as a ₹399 impulse buy, last click is usually good enough, because there are barely any touches to argue about. From one to four weeks, compare first click and last click side by side, with linear or position-based as a third lens.
For cycles over a month, like B2B software, courses over ₹50,000 or real estate leads, single-touch models fall apart. Use position-based or data-driven, and tie the data to your CRM so you track deals, not just form fills. A lead that never turns into revenue should not earn credit forever.
An easy way to find your actual cycle: open GA4, go to Advertising, then Attribution, then the Conversion paths report, and look at the time lag and path length views. If most buyers take 2 days and 2 touches, keep it simple. If they take 20 days and 6 touches, you need a multi-touch view.
Match the Model to the Question You Are Asking
Stop asking which model is best. Ask what decision you need to make. If the decision is where to put the next ₹50,000 of budget to win new customers, first click or position-based answers it. If the decision is which campaign to pause this week, last click or time decay is closer to what you need.
If the decision is whether a content channel like your blog or YouTube is worth keeping, look at linear and first click, because those are the views where content shows up at all. If the decision is how to split credit between teams, linear is a neutral starting point.
A habit that saves a lot of pain: write the question down before opening a report. It sounds trivial. It is also the thing most people skip, which is why so many dashboards get reviewed for an hour and produce no decision.
Set Up UTM Tagging That Does Not Break
UTM parameters are short tags added to the end of a URL so your analytics tool knows where a click came from. The three that matter most are utm_source (for example, instagram), utm_medium (for example, paid_social) and utm_campaign (for example, diwali_sale_2026). Without them, a lot of paid traffic lands in Direct, which wrecks every model.
The classic mistake is inconsistency. If one person tags Instagram and another tags instagram, GA4 treats them as two sources. Write a short naming rule in a shared sheet: all lowercase, underscores instead of spaces, one fixed list of allowed sources and mediums. Boring? Yes. It also saves hours of cleanup later.
Two more rules. Never add UTMs to links between pages on your own site, because that resets the session and hides the real source. And always tag email, since many email apps strip the referrer and push clicks into Direct. Google’s Campaign URL Builder is free and does the job.
Configure GA4 Conversions and Attribution Settings
In GA4, mark your important actions as key events (purchase, generate_lead, sign_up). Then go to Admin and open Attribution settings. Here you choose the reporting attribution model and the lookback windows, which usually default to 30 days for acquisition events and 90 days for all other events, with options to shorten them.
Link Google Ads to GA4 as well, so cost data and conversion data share one view. Check that your purchase event fires once per order, not twice, which is a common bug with thank-you page tracking. A duplicate purchase event doubles revenue in every model and nobody notices for months.
If tag setup, Google Tag Manager or site-level tracking feels like a wall, the web development basics in the Learn hub cover analytics setup and on-page technical fixes in plain steps. Getting the tags right first is worth more than any model choice.
Cross-Check Against Real Revenue
No attribution report should be trusted until it is compared with something outside the ad platforms. Start with the simplest check: does the total conversions in GA4 roughly match the real order count in Shopify, WooCommerce or your CRM? A gap of 10 to 20% is normal. A gap of 50% means tracking is broken.
Add a post-purchase survey with one question: how did you first hear about us? Put it on the thank-you page with a dropdown that includes Instagram, YouTube, a friend, Google search and other. Self-reported answers are messy, but they often reveal channels the tracking cannot see, like word of mouth and dark social (links shared in WhatsApp groups).
For bigger budgets, run a pause test. Switch off one channel in one region for two weeks and see what happens to total orders. If orders barely move, that channel was collecting credit, not creating sales. This is called an incrementality test, and it is the closest thing to ground truth that marketers get.
Common Attribution Mistakes to Avoid
Most attribution problems come from a short list of repeated errors. Fix these before worrying about model choice, because a perfect model fed with bad inputs still gives bad answers.
- Trusting one report. A single dashboard tells one story. Compare at least two models for the same period, and cross-check with real revenue.
- Changing models mid-month. If you switch models and compare results to last month, you are comparing different rulers. Mark the date of the change in a note.
- Ignoring lookback windows. A 7-day window on a 30-day buying cycle will credit only late-stage channels. Match the window to the actual cycle length.
- Counting view-through conversions as clicks. Meta and YouTube count people who only saw an ad. That can be fair, but keep clicks and views in separate columns.
- Letting branded search hide the truth. Always split branded and non-branded search. Branded search is mostly demand capture, and mixing it with generic search inflates results.
A Practical Setup for a Small Business
Here is a setup that works for a small shop or a service business spending ₹50,000 to ₹2 lakh a month on ads. Tag every link with UTMs. Track purchases or leads as key events in GA4. Keep GA4 on data-driven for the official view, and every month export the Conversion paths report into a sheet and add first click and last click columns by hand.
Then compare channels by role. Mark each as an introducer, a closer or a mix, based on where it tends to appear in paths. Move budget slowly, 10 to 15% at a time, and watch total revenue, not channel-level ROAS. If total revenue holds, the move was fine.
And if you want a structured path through all of this, including funnels, ad platforms and analytics, the Alpha Marketer Foundation Program covers the full digital marketing stack step by step. For learning attribution alone, though, the free articles and a sheet of your own data go a long way.
Conclusion
Marketing attribution models explained properly come down to one idea: every model is a lens, and each lens hides something. First click shows where customers begin, last click shows what finishes the sale, and linear shows who was present along the way. The mistake is picking one lens and treating it as reality.
Here is a concrete next step. Open GA4 today, pull the Conversion paths report for the last 30 days, and write down how many conversions each channel gets as a first touch and as a last touch. That one small table will probably change at least one budget decision you were about to make.
Frequently Asked Questions
These are the questions that come up again and again when people start working with attribution, from beginners trying to understand the basics to marketers wrestling with GA4 settings. Each answer stands on its own, so jump to whichever one you need.
What is a marketing attribution model?
A marketing attribution model is a rule that decides how credit for a conversion gets divided across the touchpoints a customer interacted with. The conversion could be a purchase, a lead or a signup. Different rules, such as first click, last click and linear, produce different results from the same customer journey.
What is the difference between first click and last click attribution?
First click attribution gives all the credit to the first touchpoint that introduced the customer to your brand. Last click attribution gives all the credit to the final touchpoint before the conversion. First click favors discovery channels like social and content, while last click favors closing channels like branded search and email.
What is linear attribution in marketing?
Linear attribution splits conversion credit equally across every touchpoint in the customer journey. If a customer interacted with four channels before buying a ₹4,000 product, each channel gets ₹1,000. It treats every interaction as equally valuable, which makes it fair but not very precise.
Which attribution model is best for small businesses?
There is no single best model, but most small businesses do well with last click for short buying cycles and a comparison of first click and last click for longer ones. If your product sells within a few days of discovery, keep it simple. Add a multi-touch view only when journeys get longer.
Is last click attribution still useful?
Yes, it is still useful for fast, low-priced purchases and for judging bottom-of-funnel campaigns. It is easy to audit and its data tends to be the most reliable. The problem is relying on it alone, because it hides the channels that created the demand in the first place.
Why do Meta and Google Analytics show different conversion numbers?
They use different attribution rules and different tracking methods. Meta counts conversions from people who clicked or even just viewed an ad within its attribution window, while GA4 credits channels using its own model and only sees sessions it can track. Neither is wrong. They are answering slightly different questions.
What is the default attribution model in GA4?
GA4 uses data-driven attribution as its default for key events. Google removed first click, linear, time decay and position-based models from GA4 reporting in 2023, so the main alternatives now are last click variants such as paid and organic last click. You can change this under Admin and Attribution settings.
What is a lookback window in attribution?
A lookback window is the period of time before a conversion that a tool searches for touchpoints to credit. A 30-day window means only interactions within 30 days of the sale count. If your buying cycle is longer than the window, early touches disappear from the report.
How is multi-touch attribution different from single-touch attribution?
Single-touch models, like first click and last click, give 100% of the credit to one touchpoint. Multi-touch models, like linear, time decay, position-based and data-driven, spread credit across several touchpoints. Multi-touch gives a fuller picture of the journey but needs cleaner tracking and more data to be useful.
When should you use first click attribution?
Use first click when your main question is which channels bring in brand new customers. It works well for young brands, new market launches and content or awareness budgets. Avoid using it alone for deciding on retargeting or email spend, since it ignores everything that happens after the introduction.
What is the difference between time decay and position-based attribution?
Time decay gives more credit the closer a touch is to the conversion, so recent touches win. Position-based gives fixed credit, usually 40% each, to the first and last touches and splits the remaining 20% among the middle ones. Time decay favors closers, while position-based favors both introducers and closers.
Can attribution work without cookies?
Partly. Tools now rely on first-party data, logged-in users, server-side tracking and modeled conversions to fill the gaps left by cookie loss and privacy changes like Apple’s App Tracking Transparency. The numbers are less exact than they used to be, so treat attribution as a strong estimate and cross-check it with real revenue.