


Somebody sends you a screenshot. It says 4,312 sessions, 3,104 users, 61% engagement rate, 187 key events. Then comes the question: “Is this good?” And you stare at it, nodding like you understand, while your brain quietly searches for a way out of the conversation. Almost everyone who has opened Google Analytics has been in that spot. The tool throws numbers at you, and nobody explains which ones deserve your attention and which ones are noise.
That’s the real reason people struggle with how to read a Google Analytics report. It isn’t that the numbers are hard. It’s that GA4 shows you forty things at once, calls half of them by names that sound alike, and never says “look here first.” So people do one of two things. They fixate on the biggest number on the screen, usually total users, and feel good or bad about it. Or they give up, check the dashboard once a month, and make decisions on gut feeling anyway.
This guide fixes that. We’ll go through GA4 the way a person actually uses it on a Monday morning: what each report is for, which three or four numbers decide whether a page or channel is working, what the weird labels like Unassigned and (not set) mean, and how to turn all of it into a short list of things to do this week. There’s a made-up Jaipur handloom saree store running through the examples so the numbers feel real. Nothing here needs a technical background. If you can read a bank statement, you can read this.
What You Will Learn in This Guide
Before we start, here’s the map. Each of these gets its own section, so you can jump to the part you need or read straight through. The order is deliberate: first the vocabulary, then the numbers, then the sources, then the pages, then a routine you can repeat.
- What a GA4 report really is: a table made of dimensions and metrics, filtered by a date range. Once this clicks, every report in the left menu stops looking like a different puzzle.
- The core metrics: users, sessions, engagement rate, average engagement time and key events, plus what each one measures and where it misleads you.
- Traffic sources: how Google groups visits into channels like Organic Search, Direct and Referral, and why Direct and Unassigned are usually hiding something.
- Content reports: how to read Pages and screens and Landing page to find pages that deserve more work and pages that should be deleted.
- Audience and device data: what the Tech and Demographics reports can and can’t tell you, and when mobile numbers are a warning sign.
- A weekly routine: a 20 minute checklist so you stop wandering through reports and start answering real questions.
- Common mistakes: the data quality problems that make perfectly smart people draw wrong conclusions.
How to Read a Google Analytics Report Starts With Understanding What You’re Looking At
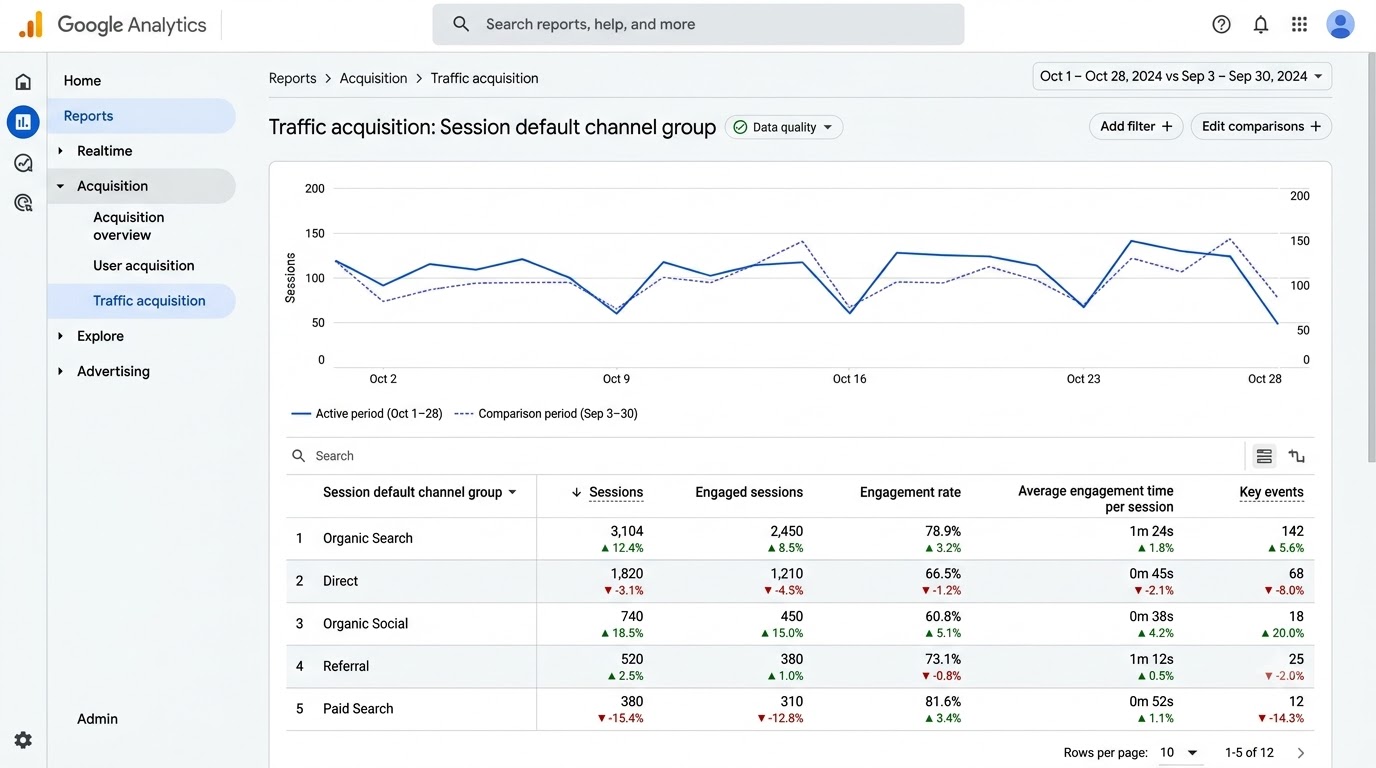
Before any metric makes sense, you need to know what kind of thing a GA4 report is. Most confusion comes from skipping this step. People jump to the numbers, forget what they’re measuring, and then misread everything. This section covers the building blocks: dimensions, metrics, report types, date ranges and the setup checks that decide whether the data is trustworthy.
A GA4 Report Is Just a Table With Opinions
Strip away the charts and cards, and nearly every GA4 report is a table. One column holds a label (like “Organic Search” or “/sarees/banarasi”), and the other columns hold numbers about that label. The charts above the table are just a drawing of the same data. Once you see this, the left menu stops feeling like sixty different tools. It’s one table, sliced in different ways.
The opinions come from Google’s defaults. Each report picks a primary label and a handful of metrics it thinks matter. Traffic acquisition labels rows by channel. Pages and screens labels rows by page title. You can change those labels with the small dropdown in the first column header, and honestly, that’s the single most useful click in the whole tool. The same numbers, relabelled, answer a completely different question.
Dimensions and Metrics: The Only Two Words You Need
A dimension is a label that describes something: the page, the country, the device, the source of the visit. A metric is a number you can count or measure: users, sessions, seconds, key events. That’s it. If you ever feel lost in a report, ask two questions. What is this table grouping by (dimension), and what is it counting (metric)?
Here’s where beginners trip. They try to add a number as a label, or they expect a label to behave like a number. GA4 won’t let you add “city” as a column of totals; it’s a label. When a report looks strange, check whether the dimension changed. Switching from “Page title” to “Page path” can split one page into five rows because the titles differ but the paths match, or the other way around.
Standard Reports vs Explorations: Which One to Open
The Reports section (left menu, second icon) holds ready-made standard reports: Acquisition, Engagement, Monetization, Retention, Demographics and Tech. These are fast, they cover the questions you ask every week, and they aren’t limited by the data sampling rules that sometimes hit custom analysis. Use them for routine checking.
The Explore section (third icon) is for questions the standard reports can’t answer, like “What path do people take before buying?” or “Where exactly in checkout do we lose people?” You build a free-form table, a funnel or a path analysis yourself. Honestly, most small sites never need Explorations in the first month. Learn the standard reports first, then go to Explore when you hit a question with no ready answer.
Date Ranges and Comparisons: Why a Single Number Tells You Nothing
Top right of every report is a date range picker. The default is the last 28 days, and that’s a decent default. The trap is looking at one period alone. Say the saree store got 3,104 users last month. Is that good? Nobody knows. If the month before had 4,200, you have a problem. If it had 1,900, you have a win.
Click the date range, toggle on Compare, and pick “Preceding period” or “Same period last year.” Now every row shows the change. Festival businesses especially need the year-over-year view, because the saree store’s October will always beat its July. Comparing October to July would just tell you that Diwali exists. A rule that saves you from embarrassment: never report a number without a comparison next to it.
Check Your Setup Before You Trust Any Report
Here’s something nobody mentions in the friendly tutorials. If your data is polluted, reading it correctly won’t help. Three checks take ten minutes. First, make sure your own visits aren’t counted: in Admin, under Data streams, define your office IP as internal traffic and activate the data filter. Second, confirm the time zone and currency in Admin > Property settings match your business. Third, open Realtime, visit your own site in another tab, and watch yourself appear.
If the tag is missing, duplicated or firing twice on some pages, you’ll see strangely high pageviews or a bounce rate that looks too good to be true. Getting the tracking code installed correctly is part of the web development basics most marketers skip and later regret. Fix the plumbing first. Then the reports mean something.
How to Read a Google Analytics Report: The Metrics That Actually Matter
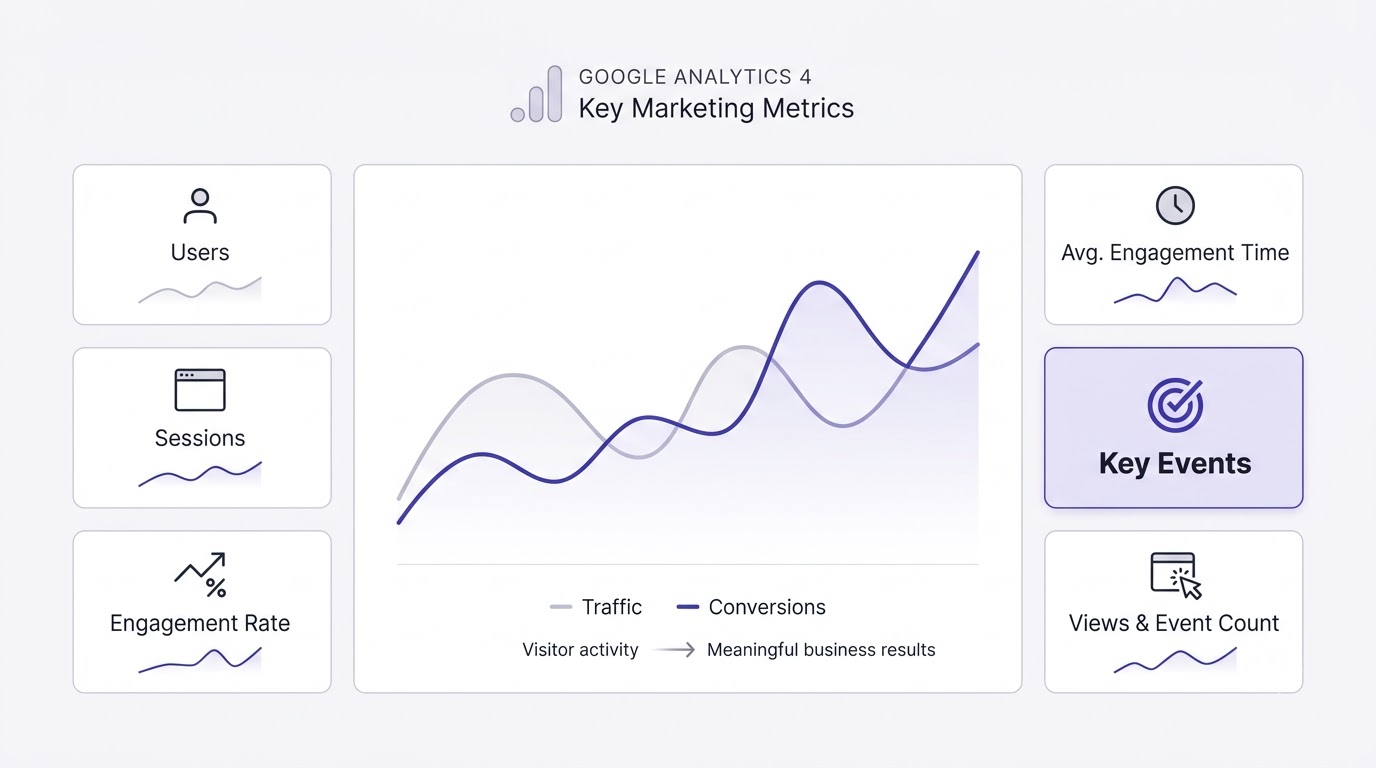
GA4 offers well over a hundred metrics, and you’ll use maybe six. Knowing which six, and what each one is really measuring, is the difference between someone who reads reports and someone who just opens them. This section walks through the numbers in the order you should care about them, and flags the ones that look useful but mislead people.
Users, New Users and Sessions: Counting People and Visits
GA4’s headline number is Active users: people who had an engaged session or triggered certain events during the period. New users counts people the property has never seen before, and Sessions counts visits. One person can create five sessions in a week, so sessions are almost always higher than users. If sessions are far higher than users, you have people coming back repeatedly, which is a good sign for a content site and a worrying sign for a store where people should buy once.
A session ends after 30 minutes of inactivity by default. Someone who browses sarees at 9 AM, goes to lunch and returns at 1 PM creates two sessions. Also, users are counted by cookies and devices unless you’ve set up User-ID, so one person on a phone and a laptop looks like two users. That’s fine. Just remember it’s an estimate, never a headcount.
Engagement Rate and Bounce Rate: The Quality Check
An engaged session in GA4 is one that lasted longer than 10 seconds, or included a key event, or had at least two page or screen views. Engagement rate is engaged sessions divided by total sessions. Bounce rate is the opposite: 100% minus engagement rate. If engagement rate is 62%, bounce rate is 38%. They’re one fact written two ways.
Bounce rate in GA4 is not the Universal Analytics bounce rate you may remember, so old benchmarks from blog posts written before 2023 don’t apply. A blog article with a 78% engagement rate is healthy. A product page at 35% is a problem. Compare pages of the same type to each other, not to some universal number. And check the metric against the traffic source, because a low rate from one channel often points at a targeting mistake, not a bad page.
Average Engagement Time: What Visitors Actually Did
Average engagement time is the time your page was in the foreground of a visitor’s browser, per active user. It replaced the old “time on page” because the old version couldn’t measure the last page of a visit at all. The new one is more honest, but it’s still an average, and averages hide a lot.
A 40 second average on a 300 word blog post is fine. On a 3,000 word guide, it means almost nobody reads it. Match the time to what the page is supposed to do. A pricing page where people spend 12 seconds either has crystal clear pricing or a confusing one, and you can’t tell from time alone. Pair it with key events: short time plus lots of conversions is a good page, short time and zero conversions needs a look.
Key Events and Key Event Rate: The Numbers That Pay the Bills
Google renamed “conversions” to key events in GA4 in 2024. A key event is any action you’ve marked as important: a purchase, a form submission, a click on the WhatsApp button, a newsletter signup. You mark them in Admin > Events by toggling “Mark as key event.” If you haven’t done this, your reports have no way to show whether the site works.
Key event rate is the share of sessions (or users) that triggered one. If 3,104 users produced 187 key events, don’t assume 6% of people converted; one person might have triggered three events. Check whether the metric is per session or per user, and make sure you only mark events that matter. Marking every scroll and click as a key event makes the number useless.
Event Count and Views: Raw Activity Measures
GA4 records everything as an event: page_view, scroll, click, session_start, purchase. Event count is the total of any one kind, and Views counts page and screen views specifically. These are activity measures. They tell you how much happened, not whether it was good.
Use them as supporting evidence. If Views on a landing page jump 400% overnight but sessions stay flat, something is firing the page_view tag twice, or a bot is hammering the page. The Events report under Engagement is a quick way to spot odd spikes, like a form_start event with no matching form_submit, which tells you people begin your form and abandon it.
Metrics That Look Important But Mostly Aren’t
A few numbers get more attention than they deserve. Total users by itself feels like a scoreboard, but 10,000 users who never buy are worth less than 800 who do. Views per user sounds great, yet it rewards confusing navigation where people click around lost. Average session duration isn’t even a standard metric in the default GA4 reports anymore.
The honest approach: pick one number per question. For “is the traffic good?” use engagement rate. For “is the page working?” use key events per session on that page. For “are we growing?” use users compared to the previous period. Everything else is supporting evidence. If a number doesn’t change a decision, stop looking at it.
How to Read a Google Analytics Report to Understand Where Your Traffic Comes From
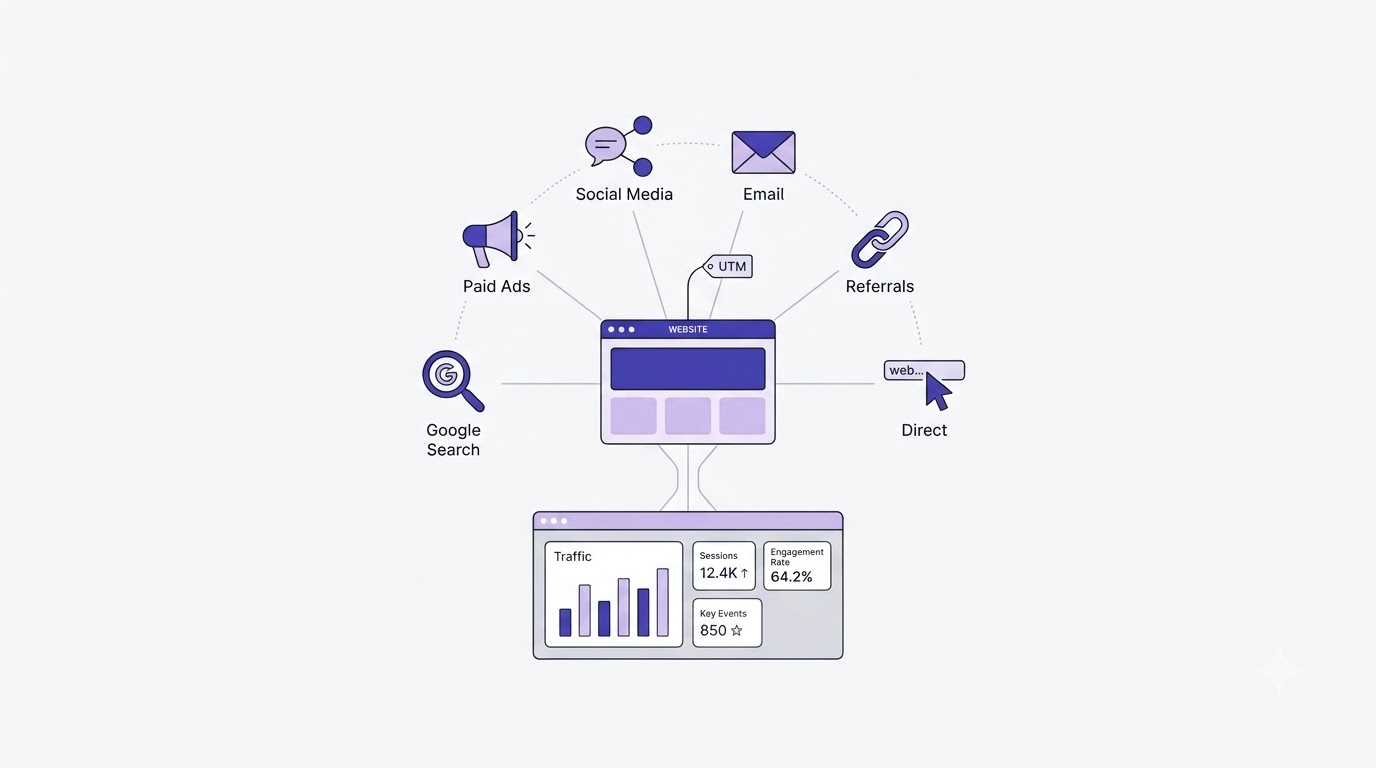
Traffic sources answer a plain question: how did these people find us? The answer decides where your next rupee or hour goes. GA4 groups visits into channels, and reading those groups properly takes a bit of care, because some labels hide more than they show. This section covers the channel report, the difference between two similar looking reports, and how to deal with the messy labels.
Default Channel Groups: What Each Label Really Means
Open Reports > Acquisition > Traffic acquisition and you’ll see rows like Organic Search, Direct, Referral, Organic Social, Paid Search, Email and Unassigned. These are default channel groups, rules Google applies to the source and medium of each session. Organic Search means someone clicked a free result on Google, Bing or similar. Referral means they clicked a link on another website. Organic Social means unpaid clicks from Instagram, Facebook, LinkedIn and so on.
The rules are mechanical. A visit with medium “cpc” from Google lands in Paid Search. A visit with medium “email” lands in Email. That means your labels are only as good as your tagging. If your newsletter links carry no tags, those clicks fall into Direct or Referral, and your email channel looks weaker than it is. Always check the channel first, then ask whether the tagging could be lying.
User Acquisition vs Traffic Acquisition: Two Reports, Two Questions
These two sit side by side in the menu, look nearly identical, and answer different questions. User acquisition uses the “First user default channel group,” meaning how a person first arrived, ever. Traffic acquisition uses the “Session default channel group,” meaning how each individual visit began. Mixing them up is the most common reporting mistake in GA4.
Use User acquisition to ask “which channels bring us new customers?” Use Traffic acquisition to ask “which channels drive visits right now, including returning people?” A woman who found the saree store through an Instagram reel in March and now comes back by typing the URL appears as Organic Social in User acquisition and Direct in Traffic acquisition. Neither is wrong. They just describe different moments.
The Direct Traffic Problem Nobody Warns You About
Direct traffic looks like people typing your address into the browser. In practice, it’s mostly a bucket for “we don’t know.” Visits from a WhatsApp link, a PDF, an email app that strips referrer data, or a secure site linking to a non-secure one often land here. On many small business sites, Direct is 30% to 50% of traffic, and almost none of that is people who memorized your URL.
So when Direct goes up, don’t celebrate brand strength just yet. Check whether you recently shared links through WhatsApp, started an email campaign without tags, or changed your site’s redirects. Honestly, a rising Direct line with a falling Email line usually means the tags broke. Treat Direct as a question to investigate, never as a conclusion.
Unassigned and (not set): What the Ugly Labels Mean
Unassigned appears when GA4 can’t match a session to any channel rule. Typical causes are a missing or misspelled medium in a UTM tag, or a campaign built with a custom medium like “promo” that no default rule recognizes. (not set) means the dimension had no value at all, which shows up in landing page and demographic data when something wasn’t collected.
A small amount is normal. A big Unassigned slice, say over 10%, means a tagging problem you can fix. Open the report, switch the dimension to Session source / medium, and look at which exact combinations sit in Unassigned. You’ll usually spot a pattern in five minutes, like a typo in “emial” or an agency using “social_paid” instead of “paid-social.”
UTM Tags: The Habit That Makes Source Data Honest
A UTM tag is a short piece of text added to the end of a link, like ?utm_source=newsletter&utm_medium=email&utm_campaign=diwali-sale. It tells GA4 exactly where the click came from. Without it, GA4 has to guess from the referrer, and it guesses wrong often. With it, you get clean rows in your reports and the right channel for every campaign.
Keep names boring and consistent: lowercase only, hyphens instead of spaces, one spelling for each source. “Instagram” and “instagram” appear as two separate rows. Never tag internal links on your own site, since that breaks the original source of the session. Tagging looks like bureaucracy for the first week and then saves you every month. It’s also how you’ll prove which part of your digital marketing spend actually brought customers.
Organic Search: Reading the Channel Most Sites Care About
Organic Search usually carries the biggest long-term value, so check it carefully. Click the Organic Search row, or add a comparison that filters to it, and look at engagement rate and key events compared to other channels. If search visitors engage well but convert badly, the page may satisfy curiosity but not buying intent. If they bounce, the page might rank for the wrong query.
GA4 doesn’t tell you which keywords brought visitors; Google hides that. For queries, you need Google Search Console, which you can link to GA4 and publish as a report in the Library. Pair the two: GA4 shows what people did after arriving, and Search Console shows what they typed before. If you’re serious about ranking, spend time in the SEO guides too, because analytics only measures results, it doesn’t create them.
Paid, Social and Email: Checking Whether Money and Time Paid Off
For Paid Search and Paid Social, compare cost data (from Google Ads or Meta) against key events in GA4. Link Google Ads to GA4 so cost and clicks appear inside the Advertising section. A channel with 2,000 sessions and zero key events isn’t a traffic win. It’s an expensive way to feel busy.
For Organic Social and Email, reading is simpler: look at engagement rate and key events per session. Social usually brings lots of shallow visits; email brings fewer, deeper ones. If Instagram sends 1,400 sessions with a 28% engagement rate and a newsletter sends 220 sessions at 71%, the newsletter is the better audience even though the number looks smaller. Judge by quality and outcome, never by raw size.
How to Read a Google Analytics Report for Pages, Content and Visitor Behavior
Once you know where people come from, the next question is what they do when they land. GA4’s engagement reports show which pages pull weight, which ones waste space and where visitors leave. Reading them well lets you decide what to rewrite, what to promote and what to delete. This section covers the page reports, landing pages, events and the device data.
Pages and Screens: Finding Your Real Workhorses
Go to Reports > Engagement > Pages and screens. By default the rows show page titles, with columns for Views, Active users, Views per user, Average engagement time, Event count and Key events. Sort by Views and you’ll see where attention goes. Then sort by Key events and you’ll see where results come from. The two lists rarely match, which is the whole point.
Some pages draw crowds and produce nothing. Others quietly drive half of your sales with modest views. The second group deserves your effort: better internal links, more content around them, maybe a spot in the main menu. Switch the dimension to “Page path and screen class” when titles repeat, since two different pages with the same title merge into one confusing row.
Landing Pages: Where Visits Begin and Where They Go Wrong
The Landing page report (Reports > Engagement > Landing page) shows the first page of each session. This is the front door, and it matters more than the homepage for most sites, because people enter through blog posts and product pages, not the home screen. Columns include Sessions, Active users, New users, Average engagement time and Key events.
Look for landing pages with high sessions and low engagement. Those are pages where Google or social sent people, and the page disappointed them. Maybe the headline promised one thing and the page delivered another. Maybe it loads slowly on mobile. The fix is usually a rewrite of the first screen: clearer headline, a visible next step, faster loading. Landing page reports are where traffic problems turn into specific tasks.
Events and the Path Between Pages
The Events report lists every action GA4 recorded, with counts and the number of users who triggered each. Standard ones include page_view, first_visit, scroll (a visitor reached about 90% of the page), click (outbound links) and file_download. Custom ones are things you add, like add_to_cart or generate_lead.
Reading it is like checking a till receipt. If begin_checkout has 400 events and purchase has 12, you’ve found a leak worth chasing. If scroll events are rare on a long article, people are leaving before the middle. Click any event name to see its parameters. That detail is where the real answers are, though most people never look. For path questions like “what did people view before buying?”, build a Path exploration in the Explore tab.
Reading Key Event Data Across Pages and Channels
Key events become useful when you cut them by something. Cut by channel: which source brings the buyers? Cut by landing page: which pages begin the buying journeys? Cut by device: is checkout fine on desktop and broken on phones? Each cut answers one question, and one question at a time is how you avoid drowning.
In the Traffic acquisition report, use the key event dropdown to pick one specific event, like purchase, rather than “All events.” Otherwise, newsletter signups and purchases get lumped together and the number lies. A store that counts a signup as equal to a sale will overspend on whatever channel produces the most email addresses, not the most revenue. Pick the event that matches the money.
Device, Browser and Screen Data: The Tech Report
The Tech overview (Reports > Tech) shows device category (mobile, desktop, tablet), browser, operating system and screen resolution. In India, mobile traffic often exceeds 75% of visits for consumer sites. The question isn’t “how many mobile users?” but “do mobile users convert as well as desktop users?”
If mobile engagement rate sits 20 points below desktop on the same page, something is broken: a slow layout, a button too small to tap, a popup that can’t be closed. Check a specific browser too. A bug that only affects Safari on iPhone will sit unnoticed in the averages until you break the report down by browser. Cross-checking with the Core Web Vitals in Search Console confirms whether speed is the culprit.
Demographics and Audience Data: Handle With Care
The Demographics reports show country, city, age, gender and interests, but they come with limits. Age, gender and interests require Google signals to be on, and only a share of users have that data. Small numbers get hidden under data thresholds to protect privacy, so you may see blanks or a note about thresholds.
Use location confidently. It’s collected for nearly everyone. Treat age and gender as rough directional hints, not facts. If the saree store sees 62% of users from Maharashtra and only 4% from Rajasthan, that’s useful for ad targeting and shipping decisions. If the age report says 80% are 25 to 34, don’t redesign the brand around it, because that sample might be tiny.
How to Read a Google Analytics Report Every Week With a Simple 20 Minute Routine
Knowing the metrics is one thing. Using them on a schedule is another. Most people open GA4, wander around for ten minutes, feel vaguely informed and close the tab with nothing decided. A fixed routine fixes that. This section gives you a weekly checklist, a worked example, the mistakes that wreck conclusions and the next steps for going deeper.
The Monday Morning Checklist: Five Reports, Twenty Minutes
Pick one time each week, and open the same five places in the same order. First, the Reports snapshot (Home) for a quick sense of users, key events and any insight cards Google surfaces automatically. Second, Traffic acquisition with last week compared to the week before. Third, Landing page sorted by sessions. Fourth, Pages and screens sorted by key events. Fifth, Tech overview for the mobile versus desktop split.
Set a timer. At each report, answer one question: what changed, and is it good or bad? Write the answer in a plain note, a spreadsheet row, anything. After a month you’ll have four weeks of notes, and patterns will jump out that no single screen ever showed you. The note matters more than the looking. If nothing gets written down, nothing gets decided, and next Monday you’ll start from zero again.
A Worked Example: The Saree Store Reads Its Numbers
Let’s make this concrete. The Jaipur handloom store (made up, but the situation is real for plenty of small shops) opens GA4 on a Monday. Last week: 3,104 users, up 9% on the week before. Fine. Traffic acquisition shows Organic Search at 1,150 sessions, Organic Social at 1,400, Direct at 640, Email at 220 and Unassigned at 190.
Now the readings. Social sends the most visits but engages at only 28%, so most people leave fast. Email engages at 71% and produces 14 of the week’s 21 purchases. Unassigned at 190 sessions is about 5% of traffic, which is worth cleaning up, because a recent WhatsApp broadcast went out with no tags. So the conclusions write themselves: send more email, tag WhatsApp links, and look at why Instagram visitors don’t stay. Three actions, twenty minutes, no panic.
Turning Findings Into Actions You Can Actually Do
The point of reading a report is to change something. A good finding has three parts: what you saw, why you think it happened and what you’ll try. “Landing page /sarees/banarasi has 2,100 sessions and a 31% engagement rate. The first screen shows a giant banner and no prices. We’ll move prices and a Shop Now button above the fold.” That’s an action with a reason.
Don’t make ten changes at once, since you won’t know which one worked. Pick the one with the biggest upside, make it, note the date and check the same page two weeks later using the date comparison. GA4 has an annotations feature in the Admin area, so you can mark the date of a change right on your timeline. Future you will be grateful when asking “why did that line jump in November?”
Data Quality Mistakes That Wreck Perfectly Good Analysis
A few problems quietly distort everything. Sampling can occur in Explorations when a query covers more than about 10 million events on standard properties; a yellow shield icon near the title warns you. Data retention for event-level data in Explorations defaults to two months and can be raised to 14 months in Admin > Data settings > Data retention. Do that on day one, because it can’t be applied retroactively.
Consent settings matter too. If your site shows a cookie banner and visitors decline, GA4 may not collect their data at all, unless you’ve set up Consent Mode. Traffic can look lower than reality. And bots and spam referrals can inflate sessions; GA4 filters known bots automatically, but odd sources with 100% bounce still appear. When a number looks too good, assume tracking trouble before assuming success.
Why GA4 Doesn’t Match Search Console, Google Ads or Shopify
It’s one of the most common questions, and the answer is boring: different tools count different things. Search Console counts clicks from Google Search results. GA4 counts sessions, which need the page to load and the tag to fire. A visitor who clicks and closes the tab before the tag loads shows as a click in Search Console and nothing in GA4. Gaps of 10% to 20% are normal.
Google Ads counts clicks; GA4 counts sessions that arrived. Shopify counts orders in its own database, while GA4 counts purchase events that fired in a browser, and ad blockers or consent choices can stop those. So never expect an exact match. Pick one tool as the source of truth for each question: Shopify for revenue, Search Console for search queries, GA4 for behavior. Check trends in each, not exact totals.
When to Go Beyond Standard Reports: Explorations and Looker Studio
Once the weekly routine feels easy, try one Exploration. A Funnel exploration shows each step from product page to purchase, with the drop-off percentage between steps. A Path exploration shows what people click after landing. A Free form exploration lets you build the exact table you wish the standard report had, like landing page by device by key events.
For reports you share with a boss or client, connect GA4 to Looker Studio, Google’s free dashboard tool, and build a one page view that updates itself. There are plenty of other analytics and reporting tools worth comparing, but the free Google stack is enough for most small businesses. Don’t build a twelve chart dashboard nobody opens. Five charts, one question each, is plenty.
Where to Go From Here If You Want to Get Good at This
Reading reports is a skill you build by doing. Set a calendar reminder, run the Monday routine for six weeks and keep the notes. By week six you’ll notice things you’d have missed in week one, like how every festival week behaves the same way, or how one blog post keeps sending buyers months after publishing.
If you want a structured path covering analytics alongside SEO, ads, email and social, the Alpha Marketer Foundation Program walks through the full set of marketing skills with practice work. It’s optional. Plenty of people learn GA4 just from a weekly habit and a curious mind, and that works fine too.
Conclusion
Learning how to read a Google Analytics report comes down to a few habits. Know whether you’re looking at a label or a number. Trust engagement rate, engagement time and key events over raw traffic. Compare every figure against an earlier period. Treat Direct and Unassigned as questions. Check your tracking before drawing conclusions.
Your next step is small. This week, open Traffic acquisition, turn on the comparison with the previous period and write down three observations. Then do the same next Monday. That’s the whole method, and it beats any fancy dashboard you could build today.
Frequently Asked Questions
What is the easiest way to read a Google Analytics report as a beginner?
Start with one report and ask one question. Open Reports > Acquisition > Traffic acquisition, turn on the date comparison, and look at which channel brings the most engaged visitors. Read the first column as the label (dimension) and the other columns as numbers (metrics). Ignore everything else until that feels natural, then add the Landing page report.
Which metrics matter most in a GA4 report?
For most websites, five matter: active users, sessions, engagement rate, average engagement time and key events. Users and sessions show size, engagement rate and time show quality, and key events show results. If you can only watch one, watch key events, since they connect traffic to actual business outcomes like sales or leads.
What is a good engagement rate in Google Analytics 4?
There’s no universal number, but many content sites land between 55% and 75%, and well targeted blogs often exceed that. Store product pages and paid landing pages run lower. Compare pages of the same type and channels against each other. A sudden drop of 10 points or more on a steady page usually signals a problem worth investigating.
What is the difference between bounce rate and engagement rate?
They’re two sides of the same measurement. Engagement rate is the percentage of sessions that were engaged (over 10 seconds, or with a key event, or with two or more page views). Bounce rate is 100% minus that figure. If engagement rate is 65%, bounce rate is 35%. GA4 shows engagement rate by default; bounce rate can be added through the report customization.
What does Unassigned mean in GA4 traffic acquisition?
Unassigned means GA4 couldn’t match a session to any default channel rule. This often happens when UTM tags have a missing or non-standard medium, or when campaign data wasn’t passed properly. A small share is normal. If it’s above about 10% of sessions, inspect the source and medium combinations and fix your tagging.
Why is my Direct traffic so high?
Direct traffic includes more than typed URLs. Visits from untagged WhatsApp or email links, apps that remove referrer data, some secure-to-insecure redirects and bookmarks all land there. High Direct usually points to missing UTM tags rather than strong brand loyalty. Tag your campaign links and check which landing pages Direct visitors land on for clues.
What are key events in GA4, and how do I set them up?
Key events are actions you mark as valuable, like purchases, form submissions or contact button clicks. Google renamed them from conversions in 2024. To set one up, make sure the event is being recorded, go to Admin > Data display > Events, and switch on “Mark as key event” for that event name. Wait up to a day for it to appear in reports.
How long does it take for GA4 data to show up in reports?
Realtime shows activity within seconds. Standard reports can take 24 to 48 hours to fully process, and some data, like key events or Search Console metrics, may arrive later. For that reason, avoid judging yesterday’s numbers. Wait two or three days before comparing a recent period, especially for daily changes.
Why don’t my GA4 numbers match Search Console or Google Ads?
Each tool counts something different. Search Console counts clicks from Google results, Google Ads counts ad clicks and GA4 counts sessions where the tag loaded. Ad blockers, consent choices, slow pages and closed tabs create gaps. A difference of 10% to 20% is common. Compare trends over time rather than exact totals.
Can I see which keywords bring people to my site in GA4?
Not directly. Google hides most search query data from analytics tools. To see queries, link Search Console to GA4 and publish the Search Console reports in the Library, or use Search Console on its own. It shows queries, impressions, clicks and average position, which together fill the gap GA4 leaves.
How often should I check my Google Analytics reports?
Once a week is enough for most small sites. Daily checking leads to overreacting to normal ups and downs. A weekly 20 minute review plus a deeper monthly look at trends gives better decisions. Check more often only during launches, sales or campaigns, when quick feedback changes what you do next.
Do I need Explorations, or are standard reports enough?
Standard reports cover most weekly needs: traffic sources, pages, devices and key events. Explorations help when you need a custom breakdown, a funnel or a path analysis. Beginners should master standard reports first. Move to Explorations when you hit a specific question that no ready-made report answers.
Is Google Analytics free, and is it accurate enough to rely on?
GA4 is free for standard properties, with paid options (Analytics 360) for enterprise needs. It’s accurate enough for trends and decisions, though not perfect, because consent banners, ad blockers and cookie limits cause undercounting. Use it to see direction and compare periods, not to count individual people exactly.