


I once sat through a meeting where a client scrolled past twenty two slides of a report in about four seconds and asked, “so did we grow or not?” That question stung, because the report had every metric you could think of. Impressions, CTR, bounce rate, session duration, conversion rate, cost per click, you name it. What it didn’t have was an answer. And that’s the problem with most digital marketing reports I’ve seen in five years of doing this work: they’re full of numbers and empty of meaning.
If you’ve ever built a report and gotten silence back, or a one line reply that says “looks good, thanks,” that’s not a compliment. That’s someone who didn’t actually read it. Learning how to create a digital marketing report that people open, understand, and act on isn’t about fancier charts or more data. It’s about structure, judgment, and knowing exactly who you’re writing for before you pull a single number.
In this guide I’m going to walk you through the whole process the way I actually do it, from the planning that happens before you open a spreadsheet, to the template and tools I use, to the mistakes that quietly kill most reports, and a full walkthrough of building one from scratch. Whether you’re a student building your first report for a mock client, a freelancer reporting to a small business owner, or someone on an in house team reporting to a CMO, this covers all of it.
I’ve built hundreds of these at this point, across e-commerce brands, SaaS clients, and B2B accounts with budgets ranging from a few thousand rupees a month to campaigns spending in the crores. The tools change, the platforms change, but the underlying discipline of turning raw numbers into something a person can actually use doesn’t. That’s what this guide is really about, not memorizing a template, but building the judgment to know which numbers matter and how to present them so they land.
What You Will Learn in This Guide
- How to define the real purpose of a report before touching any data, so you don’t waste hours building the wrong thing.
- The exact step by step framework I use to go from raw numbers to a report someone can act on in under five minutes.
- Which tools to use for pulling and presenting data, and when a simple spreadsheet beats a flashy dashboard.
- The most common mistakes that make reports get ignored, and how to avoid every one of them.
- A full, real style walkthrough of building a monthly digital marketing report from a blank template to a finished document.
- Answers to the questions people actually search when they’re stuck on this exact task.
What Goes Into a Digital Marketing Report Before You Even Open a Spreadsheet
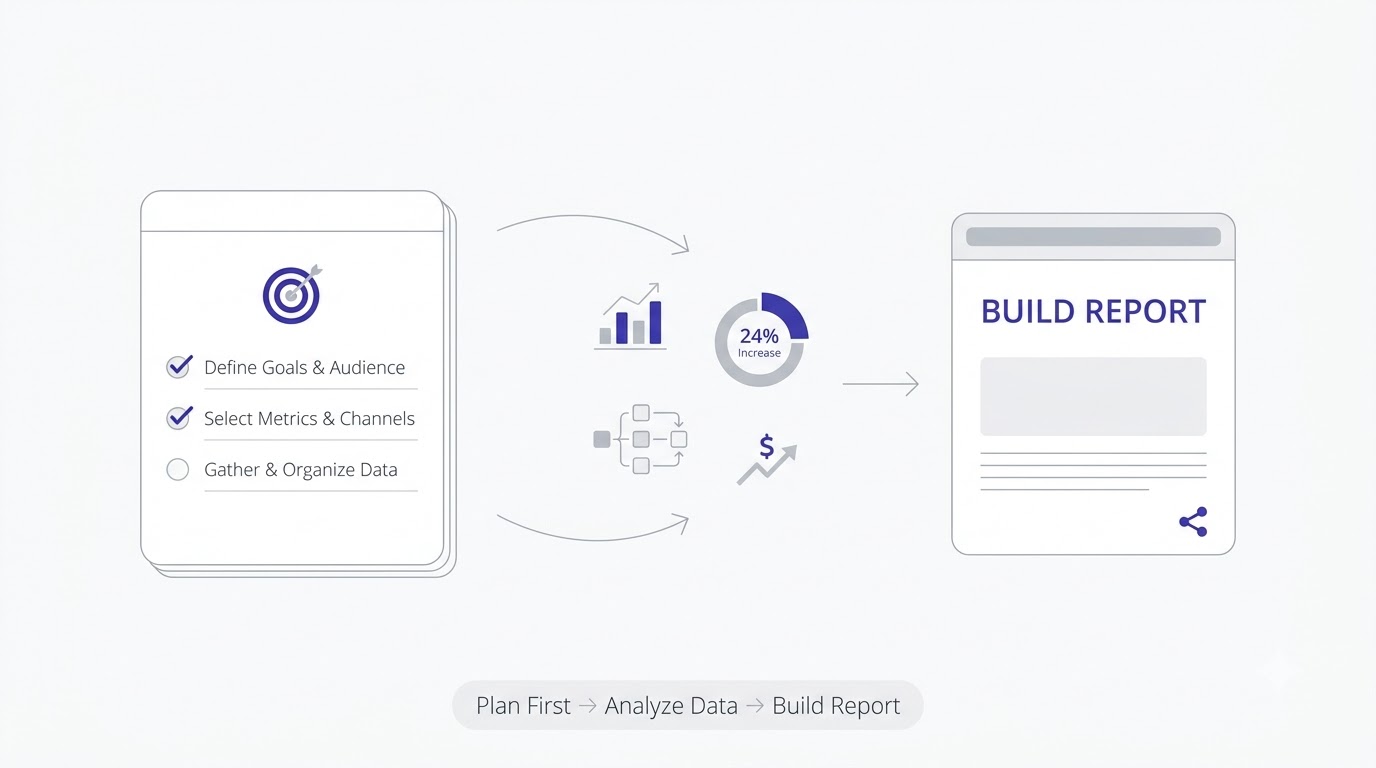
Before I explain how to create a digital marketing report step by step, I want to slow down on something almost nobody talks about: the thinking that happens before you touch any data. Most people open Google Analytics, start exporting numbers, and figure out the story later. That’s backwards. It’s also why so many reports read like a printout instead of a document written by a human who understands the business.
This planning phase usually takes me fifteen to twenty minutes, sometimes less once you’ve done it a hundred times, and skipping it almost never actually saves time. It just moves the confusion downstream, so instead of spending twenty minutes upfront figuring out what matters, you end up spending an hour rebuilding a report after the first draft misses the point entirely.
Why Most Marketing Reports Get Ignored
Here’s the thing. A report gets ignored when the reader has to do the interpretation themselves. If your client has to squint at a bar chart and figure out whether a 12% drop in organic traffic is bad news or expected seasonal dip, you’ve already lost them. Busy people, and almost everyone reading a marketing report is busy, will skim the first page, not find an answer, and move on with a vague sense that “the numbers went up I think.”
I learned this the hard way early in my career at Tattvam Media. I built a gorgeous fifteen page report for a D2C skincare brand, full of charts, color coded by channel, beautifully formatted. The founder replied two days later asking, “so should we pause Google Ads or not?” That was literally the only decision she needed from the report, and I’d buried the answer somewhere on page nine. Since then, every report I write leads with the decision, not the data.
There’s a psychology reason this happens too, and it’s worth understanding, not just avoiding. Most people scanning a report are doing it between other tasks, on a phone, in a gap between meetings. They’re not sitting down to study it the way a student studies a textbook. That means your first sentence, quite literally, is doing most of the work. If it doesn’t tell them something useful in ten seconds, the rest of the document, no matter how good, rarely gets read properly.
The Difference Between a Report and a Data Dump
A data dump is every number your tool can spit out, arranged neatly. A report is a small, curated set of numbers, chosen specifically because they answer a question the reader actually has. That distinction sounds obvious once you say it out loud, but almost every reporting template you’ll find online skips it entirely and just gives you a list of metrics to fill in.
The test I use is simple: if I removed a metric from the report, would the reader’s decision change? If the answer is no, that metric doesn’t belong in this version of the report. It might belong in a backup appendix for someone who wants to dig deeper, but it shouldn’t be sitting on the main page competing for attention with the numbers that actually matter.
I actually run this test out loud with junior team members when I’m reviewing their first drafts. I’ll point at a metric and ask, “if this number wasn’t here, what would the client do differently?” More often than not, the honest answer is nothing, which means the metric was included out of habit, because it was easy to export, not because it was useful. Habit is the enemy of a good report. Every single number on the page should have had to earn its place.
Who Actually Reads This Report (and Why That Changes Everything)
This is the part most guides skip entirely, and it’s honestly the most important step in the whole process. A performance marketing manager wants channel level detail: CPC trends, audience segment performance, creative fatigue signals. A founder or CEO wants three things: are we growing, is it profitable, what do we do next. A client who isn’t marketing savvy wants plain language and a clear “yes this is working” or “no it isn’t, here’s why.”
If you send the same report to all three of those people, at least two of them will be frustrated. I keep a simple rule: build one master data source, but tailor the report layer to the audience. For a founder, I might cut the report down to a single page with three headline numbers and a two sentence summary. For the same client’s marketing manager, I’ll hand over the full channel breakdown with raw numbers, because that’s genuinely useful to them and won’t overwhelm them the way it would a non marketer. A well thought out digital marketing strategy always accounts for who’s consuming the output, not just who’s executing the plan.
Honestly, this is one of those things nobody teaches you formally. You just figure it out after sending the wrong version of a report to the wrong person a few too many times and watching the confused reply come back. My advice for anyone starting out: ask directly, before you build anything, “what do you personally want to know from this report, and how much detail is useful versus overwhelming for you?” People are almost always happy to answer that question, and it saves you from guessing wrong.
How to Create a Digital Marketing Report Step by Step: The Core Framework
Now let’s get into the actual mechanics. This is the part people usually search for when they type “how to create a digital marketing report” into Google, and honestly most of what ranks for that phrase gives you a generic checklist. I’m going to walk through each step the way I genuinely do it, with the reasoning behind each one, because the reasoning is what lets you adapt this to any client or campaign, not just the exact example I’m using.
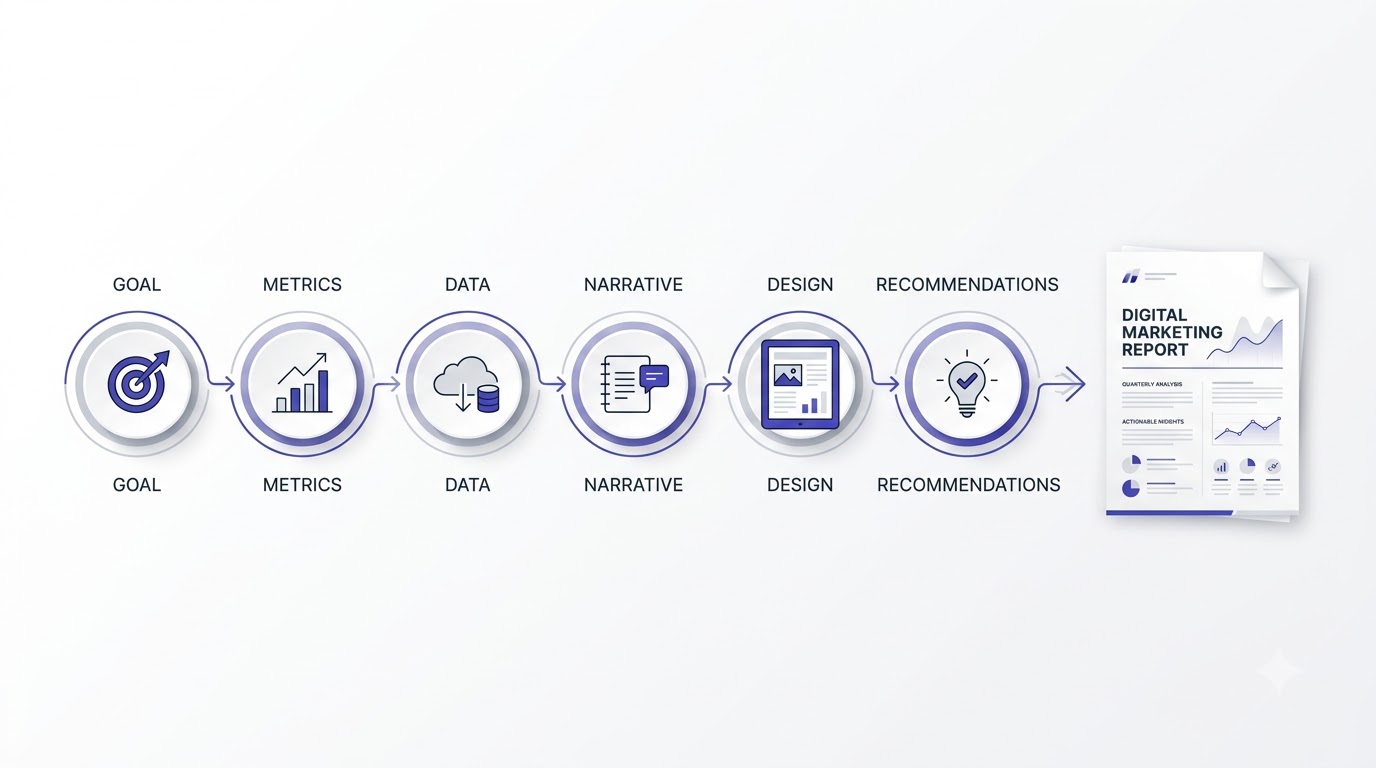
Six steps, in order, every single time: define the goal, pick the metrics, pull the data, build the narrative, design the layout, and add recommendations. Skipping a step, or doing them out of order, is usually where reports go sideways. I’ve seen people jump straight to pulling data before defining a goal, which almost always results in a report that’s technically accurate but doesn’t actually help anyone decide anything.
Step 1: Define the Goal Before You Touch a Single Metric
Every report starts with one question I ask myself, or ask the client directly if I’m not sure: what decision does this report need to support? Sometimes it’s “should we increase the ad budget.” Sometimes it’s “is the SEO work actually paying off, because the client is getting nervous six months in.” Sometimes it’s internal, like a monthly check in to catch problems early before they become expensive ones.
Write that goal down at the top of your working document, literally in a text box or a comment, before you build anything. It sounds almost too simple to matter, but I’ve watched junior marketers spend three hours building a report that answers a question nobody was actually asking. If the goal is “prove SEO is working,” your report needs organic traffic trend, keyword ranking movement, and a rough estimate of the traffic value in ad spend terms. If the goal is “should we increase ad spend,” you need ROAS trend, marginal CPA as spend increased in past tests, and audience saturation signals. Different goals, completely different reports, same underlying data source.
Nope, you don’t need a new data source every time, and that’s actually good news. Most teams overcomplicate this by thinking each report requires fresh data collection. In reality, you’re pulling from the same handful of platforms every time, GA4, Search Console, your ad platforms, your ESP. What changes is the lens you apply to that data based on the goal you wrote down. Think of the goal as the filter that decides which of those hundreds of possible numbers actually make it into this particular version of the report.
Step 2: Pick the Right Metrics for the Right Audience
Once the goal is locked, pick five to seven metrics maximum for the primary summary. I know that feels restrictive if you’re managing a campaign with dozens of trackable data points, but restriction is exactly what makes a report readable. If it helps, think in three tiers: north star metrics (revenue, leads, conversions, the number the business actually cares about), supporting metrics (traffic, CTR, engagement rate, the things that drive the north star), and diagnostic metrics (bounce rate, page load time, ad frequency, the things you check when something’s wrong).
Your main report should lead with north star metrics, support them with two or three supporting metrics, and only pull in diagnostic metrics when there’s a story that needs explaining, like a sudden drop you need to account for. I made the mistake early on of treating all metrics as equally important, which resulted in reports where a 0.3% change in bounce rate got the same visual weight as a 40% increase in qualified leads. That’s a design failure as much as a strategy failure, and it teaches the reader to stop trusting your judgment about what matters.
Look at what actually happens when you get this tiering right. A client scans the top of the page, sees leads and revenue moving in the right direction, and immediately feels reassured, without needing to understand a single thing about how the campaign was structured. Then, if they want to know why, the supporting metrics right below give them the mechanism. And if something looks off, the diagnostic layer is right there waiting, instead of cluttering up the top of the page for the ninety percent of months when nothing unusual happened at all.
Step 3: Pull Data From the Right Tools (Not Just Google Analytics)
Most people default to Google Analytics 4 for everything, which is fine for site behavior and conversion tracking, but it’s genuinely the wrong single source for a complete picture. Here’s how I actually source data depending on what the report needs to cover.
For paid search and paid social performance, I pull directly from the ad platform (Google Ads, Meta Ads Manager) rather than trusting GA4’s attribution, because platform level attribution and GA4 attribution rarely match exactly, and mixing sources without acknowledging that mismatch confuses clients who compare numbers across two different reports. For organic search, Google Search Console gives you the actual query and impression data GA4 doesn’t have, which matters a lot if the report needs to show keyword level movement, not just “organic traffic went up.” For email marketing performance, pull straight from your ESP (Mailchimp, Klaviyo, whichever you use), since GA4’s email tracking depends on UTM discipline that’s rarely perfect in practice.
The mistake most people make at this step is trying to force every channel’s data into GA4 and treating it as the single source of truth. It isn’t, and pretending it is creates small inconsistencies that a sharp client will eventually catch and start questioning your whole report.
That’s why, on any report where numbers get compared across platforms, I add a small footnote explaining the source and methodology for each figure. Something as simple as “revenue figures sourced from platform reported conversions, may differ slightly from GA4 due to attribution model differences” heads off the awkward “why don’t these numbers match” question before it ever gets asked. Small detail, but it’s saved me more than one uncomfortable email thread, especially with finance-minded clients who cross check numbers against their own accounting software and expect every figure to reconcile perfectly.
Step 4: Build the Narrative Around the Numbers
This is where most reports fail, and it’s the step I’d bet money most guides on this topic skip almost entirely. Numbers without a narrative are just trivia. Your job is to answer three questions for every major metric: what happened, why it happened, and what we’re doing about it.
Take a concrete example. Say organic traffic dropped 18% month over month. “What happened” is easy, that’s just the number. “Why it happened” requires actual investigation: did you check Search Console for a ranking drop, was there a Google algorithm update that month, did a seasonal trend explain part of it, did a technical issue like a broken redirect chain quietly tank a key landing page. “What we’re doing about it” is the part that actually earns trust: “we identified that three product pages lost featured snippet placement after the March core update, and we’re rewriting those pages this week with more direct answer formatting.” That sentence alone does more for client retention than every chart in the report combined.
Here’s the thing most people get wrong about this step: they treat the investigation part as optional, something to do only if a client specifically asks. It shouldn’t be optional. Building that habit of checking why before you report what changes how you work entirely. You stop being someone who reports numbers and start being someone who understands the account well enough to explain it, and clients notice that difference fast, even if they can’t always articulate exactly what changed.
Step 5: Design the Report So People Actually Read It
Design isn’t decoration here, it’s function. A well designed report gets read top to bottom in under five minutes by someone who’s genuinely busy. A poorly designed one gets skimmed for thirty seconds and closed. I’ve watched this happen in real time during screen shares, someone opens a beautifully built but cluttered report, their eyes dart around trying to find the point, and within ten seconds they ask “so what am I looking at here” instead of just understanding it on their own. The structure I use every time: an executive summary at the very top (three to five sentences, no charts), then the headline metrics as big, simple numbers with a clear up or down indicator and comparison period, then channel or campaign breakdowns, then an appendix for anyone who wants the raw detail.
Keep your color palette to two or three colors max, and use color meaningfully, green for growth, red for decline, not just because it looks nice. Avoid pie charts for anything with more than four segments, they get unreadable fast, a simple bar chart almost always communicates the same information more clearly. If you’re a beginner and design still feels intimidating, spending an hour inside Canva or a similar graphic design tool to learn basic visual hierarchy will improve every report you build after that, not just this one.
One thing I’d add here that most people never think about: consistency across months matters more than making each individual report look impressive. If your chart types, colors, and layout shift every month, the reader has to relearn how to read your report every time instead of just scanning for what changed. Pick a format, stick with it for at least six months, and only change it if you get direct feedback that something isn’t working.
Step 6: Add Recommendations, Not Just Results
The single biggest difference between a report that gets you a contract renewal and one that quietly gets a client shopping for a new agency is the recommendations section. Results tell someone what happened. Recommendations tell them what happens next, and that’s the part clients are actually paying for, whether they say it out loud or not.
Keep this section to three recommendations maximum, ranked by expected impact, each with a one line reason why. “Increase budget on the Retargeting campaign by 20%, because it’s currently converting at 4.2% against a 1.1% account average and hasn’t hit audience saturation yet” is a recommendation someone can approve in ten seconds. Vague suggestions like “continue optimizing campaigns” aren’t recommendations, they’re filler, and clients can tell the difference immediately.
I’d honestly argue this is the section that determines whether a client renews with you or not, more than any other part of the report. Anyone can report what happened last month. What clients are actually paying an agency or a marketer for is judgment about what to do next. If your recommendations section reads like it could have been written by anyone with access to the data, you haven’t added enough of your own experience to it yet.
Choosing the Right Digital Marketing Report Template and Tools
Once you understand the framework, the next question is almost always “okay but what do I actually build this in?” I get asked this constantly by students, so let’s go through it properly. And to be clear upfront: there’s no single “best” tool. The right choice depends entirely on how often you’re reporting, who’s reading it, and how much time you have to maintain it every month.
Google Looker Studio vs Excel vs Slides: What to Use When
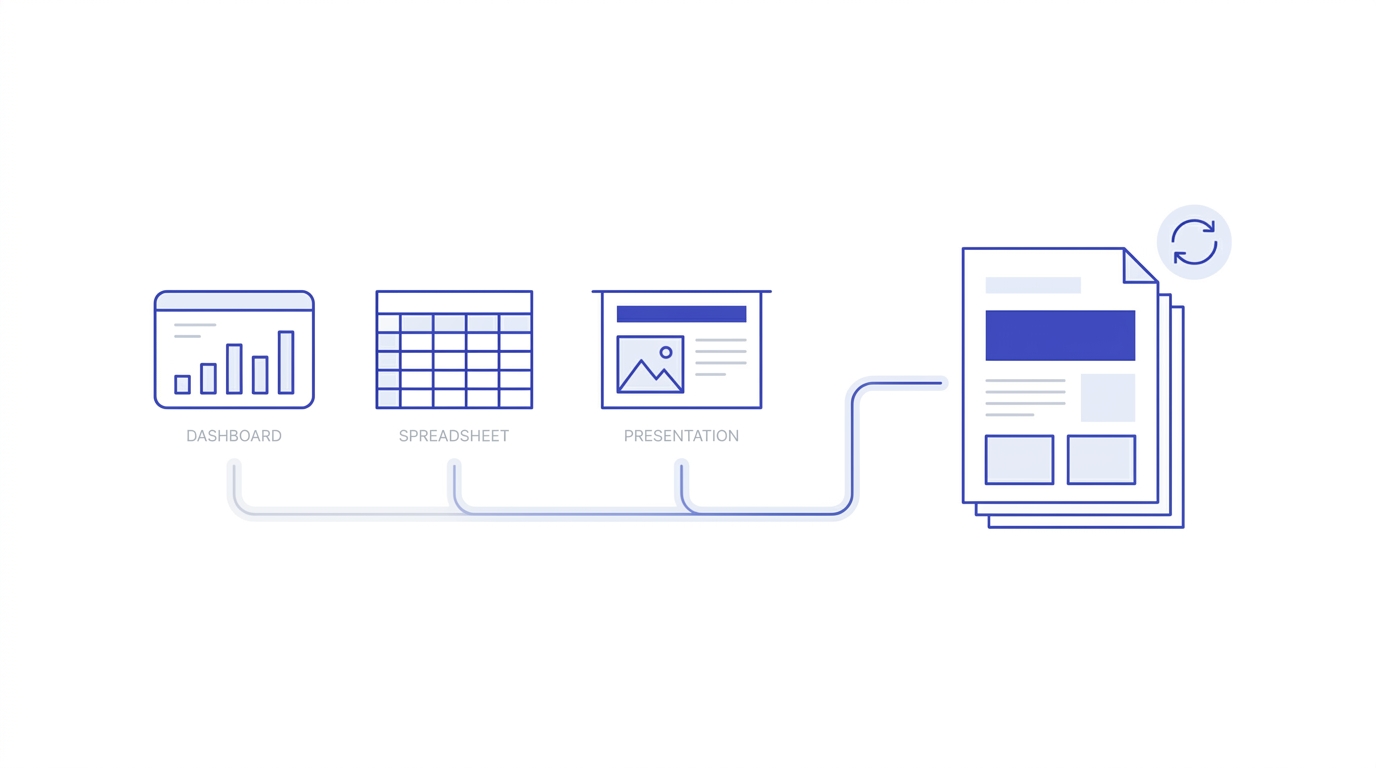
Looker Studio (the free tool Google used to call Data Studio) is my default for any recurring monthly or weekly report, because it connects directly to Google Analytics, Google Ads, Search Console, and dozens of other sources, and once it’s set up it refreshes automatically. You build it once, connect the data sources, and every month the numbers update themselves without you touching a spreadsheet. The learning curve is real though, expect to spend a few hours the first time getting comfortable with blending data sources and setting up date range controls.
Excel or Google Sheets still wins for highly custom, one off analysis, especially when you need to do calculations Looker Studio doesn’t handle natively, like custom attribution modeling or blended CAC across multiple channels with different cost structures. I also use Sheets as the staging layer even for Looker Studio reports sometimes, pulling raw exports in, cleaning them, then feeding the cleaned sheet into Looker Studio as a source.
Slides or PowerPoint makes sense for high stakes presentations, like a quarterly business review in front of leadership, where you’re presenting live and want full control over pacing and visual storytelling rather than a dashboard someone scrolls through on their own. I use Slides maybe once a quarter, Looker Studio every single month, and Sheets constantly in the background for calculations neither of the other two handles well.
People ask me constantly whether they need to pay for a premium reporting tool when they’re starting out, and honestly, no. Looker Studio’s free tier handles almost everything a small business or freelancer needs. I didn’t touch a paid reporting platform until I was managing reporting across more than a dozen client accounts at once, and even then it was for automation convenience, not because the free tools couldn’t technically do the job.
Setting Up a Reusable Report Template
Build your template once, properly, and you’ll save yourself hours every single month going forward. This is genuinely one of those tasks where an hour or two of upfront setup pays for itself within the first three or four reporting cycles, and yet it’s the step most freelancers and even some agencies skip, rebuilding a report from a blank file every single month out of habit rather than convenience.
Start with a Google Sheet or Looker Studio file structured in four sections: a summary tab with your five to seven north star metrics and their month over month comparison, a channel breakdown tab, a campaign level detail tab for anyone who wants to dig deeper, and a notes tab where you log anything unusual that happened that month (an algorithm update, a site outage, a big sale event) so future you remembers why a spike or drop happened.
Lock your formulas and formatting in a master template file, then duplicate it fresh each month rather than editing a live file, so you always have a clean historical record you can go back to. I keep every month’s report as a separate file in a dated folder structure, which has saved me more than once when a client asks “what did we say about this back in March” six months later.
That notes tab I mentioned deserves its own callout, honestly, because almost nobody builds one and it’s such a small addition for how useful it is. Six months into a client relationship, you’ll have forgotten exactly why traffic spiked in April or why conversion rate dipped in July. A two line note written in the moment, “ran a 20% off sitewide sale July 12 to 15,” saves you from re-investigating the same question later, or worse, guessing wrong when a client asks about it.
Automating Data Pulls So You’re Not Copy-Pasting Every Month
Manually copy pasting numbers from four different platforms into a report every month is exhausting, and it’s also where errors sneak in. Looker Studio’s native connectors handle Google properties automatically. For Meta Ads or other platforms without a clean native connector, tools like Supermetrics or Windsor.ai pull data directly into Sheets or Looker Studio on a schedule, so by the time you sit down to write the narrative, the numbers are already there waiting for you.
If you’re managing reporting for multiple clients, this automation isn’t optional, it’s the difference between reporting taking twenty minutes a month per client versus three hours. I’d genuinely recommend anyone serious about a reporting or analytics career spend real time inside a proper SEO and analytics learning path early on, because understanding how the underlying data actually gets tracked makes automating and troubleshooting these pulls infinitely easier.
One warning worth mentioning here: automation can quietly break without you noticing, especially when a client changes ad accounts, a UTM naming convention shifts, or a platform updates its API. I check every automated connector at the start of each reporting cycle, just a quick glance to confirm the numbers look reasonable before I build the narrative on top of them. Trusting an automated pull blindly is how wrong numbers end up in front of a client, and that’s a much worse problem than spending an extra five minutes copy pasting manually.
I actually keep a rough sense of what “normal” looks like for each account, so a broken connector or a data gap jumps out immediately instead of quietly slipping into the final report. If organic sessions suddenly show as zero for three days in a row, that’s almost never a real traffic collapse, it’s a tracking issue, and catching it before the client does is part of doing this job properly.
Mistakes People Make When Building a Digital Marketing Report
I’ve reviewed a lot of reports from junior team members and freelancers over the years, and the same handful of mistakes show up constantly. Let’s go through them so you can catch yourself before a client does. None of these are complicated to fix once you know to look for them, which is honestly the frustrating part, they’re small habits, not skill gaps, and yet they’re the reason so many otherwise solid reports fall flat.
Reporting Vanity Metrics Without Context
Impressions, followers, likes, page views, these numbers feel good to report because they’re usually going up, but on their own they don’t tell anyone whether the business is actually benefiting. A campaign can generate a million impressions and zero revenue. If you’re going to include a vanity metric, and sometimes you should, pair it immediately with the metric that gives it meaning. “Impressions grew 40%, but click through rate dropped from 2.1% to 1.3%, meaning the extra visibility isn’t converting to engagement yet” tells a real story. Impressions alone tells nothing.
I get why people lean on vanity metrics though, and it’s not always laziness. Sometimes the real metrics genuinely didn’t move much that month, and reporting a big impressive number feels safer than admitting a quiet month. Resist that urge. Clients respect an honest “not much changed this month, here’s why, and here’s what we’re testing next” far more than they respect a report that quietly dresses up a flat month with an unrelated metric that happened to look good.
Ignoring the “So What” Behind Every Number
This connects back to the narrative point from earlier, but it’s worth its own section because it’s the single most common issue I see. A number sitting alone on a slide, no matter how big or colorful, doesn’t answer anything. Before you finalize any report, go through every single metric and ask yourself, out loud if you have to, “so what does this mean for the business.” If you can’t answer that in one sentence, either cut the metric or dig deeper until you can answer it.
I actually built a personal checklist for this after getting burned by it a few too many times. Right before I send any report out, I read it once purely as the client, not as the marketer who built it. If a sentence makes me go “okay but what does that mean,” I stop and fix it right then, before it ever reaches the client’s inbox. That single habit has probably saved more client relationships than any campaign optimization I’ve ever run.
Making the Report Too Long or Too Technical
I get it, when you’ve worked hard on a campaign you want to show everything you did. But a twenty page report doesn’t demonstrate more value than a three page one, it demonstrates that you didn’t take the time to figure out what actually mattered. Cut ruthlessly. If a metric requires you to explain what it even means before you can explain why it changed, it probably belongs in an appendix, not the main body, unless your audience is specifically technical.
There’s a version of this mistake that’s less about length and more about jargon, and it’s just as damaging. Terms like “impression share,” “quality score,” “domain authority,” or “attribution window” are second nature to us, but they’re not to most clients. Every time you use a term like that without a plain explanation the first time it appears, you’re quietly asking the reader to either stop and Google it or just nod along without really understanding. Neither outcome builds trust.
Not Adjusting the Report for Different Stakeholders
I touched on this earlier, but it’s worth repeating because it’s such a common failure point. Sending the exact same fifteen page channel by channel breakdown to a small business owner that you’d send to an in house performance marketing lead is a mismatch that quietly damages trust, even if every number in it is accurate. The owner doesn’t have the vocabulary or bandwidth to parse CPM trends and audience overlap data, and forcing them to try just makes them feel like the report, and by extension your work, is confusing and hard to trust.
Yeah, building two versions of a report feels like extra work at first, and if you’re managing this manually every month it can genuinely add up. But once your data source is centralized and automated the way I described earlier, spinning off a second, simpler view takes maybe fifteen extra minutes. That’s a small price for a client who actually reads and understands what you’re sending them, versus one who quietly stops opening your emails.
A Real Example: Building a Monthly Digital Marketing Report From Scratch
Let me walk you through how this actually looks in practice, using a composite example based on the kind of small e-commerce clients I’ve worked with. No real client names here, but the structure and numbers are representative of a genuine month. Everything I’ve explained so far is a lot easier to understand with a real walkthrough attached to it, so let’s put the framework to work.
Setting Up the Report Structure
The client is a mid sized D2C skincare brand running SEO, Google Ads, and email marketing. The goal that month, as we defined in step one, was “confirm whether the SEO investment over the past five months is paying off, because the client’s finance team is questioning the retainer.” That single sentence shaped the entire report. Everything I pulled and everything I cut connected back to answering that question directly.
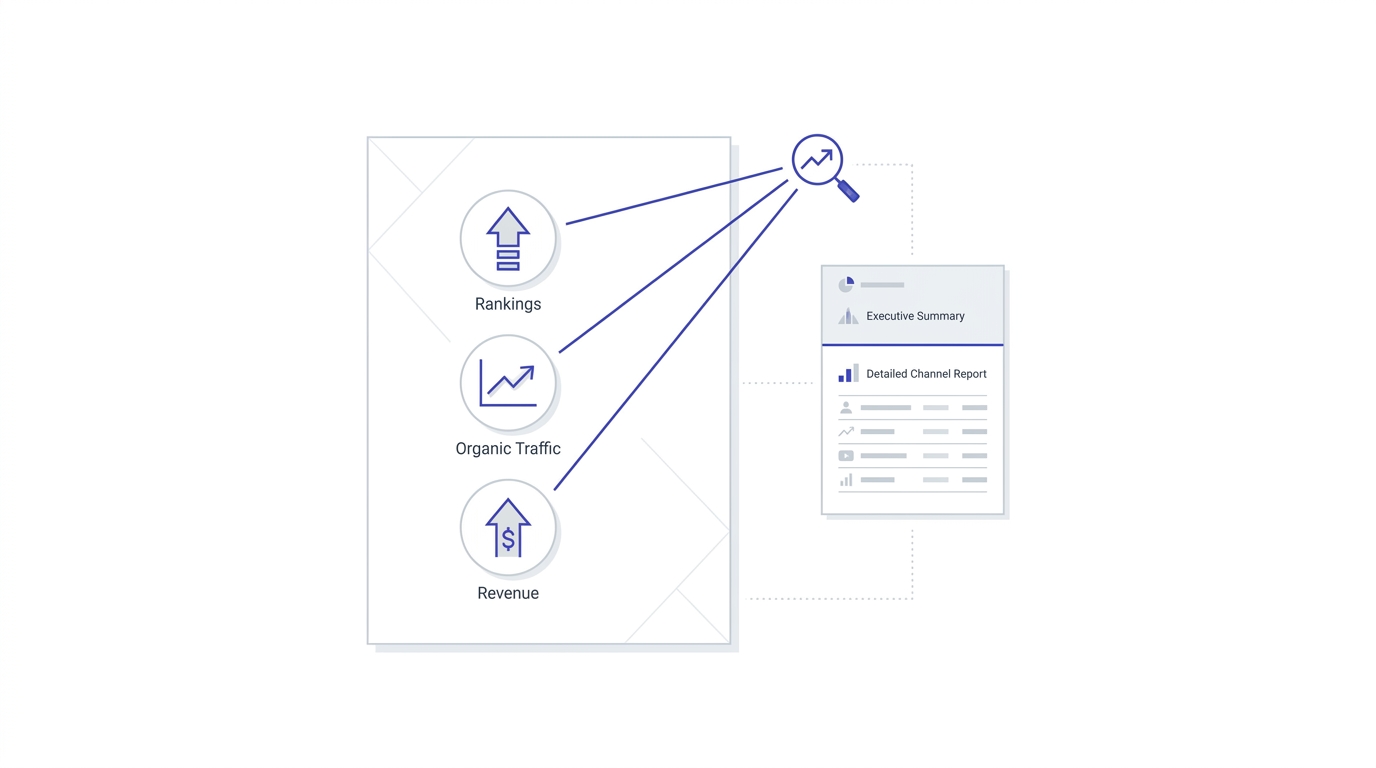
I built the summary tab with three north star numbers: organic revenue (pulled from GA4 e-commerce tracking filtered to organic/search channel), organic sessions, and average keyword position for the client’s twelve priority commercial keywords (pulled from Search Console). That’s it for the headline section. Three numbers, each directly tied to the question being asked.
Notice what’s missing from that list. No email open rates, no Instagram engagement, no Google Ads impression share, even though the client ran all of those channels that month too. None of it connected to the specific question this report needed to answer, so none of it made the summary tab. It all still lived in the full channel breakdown further down the document for anyone who wanted it, but it wasn’t competing for attention with the three numbers that actually mattered for this particular conversation.
Walking Through the Numbers Section by Section
Organic revenue was up 34% compared to the same period five months earlier, from roughly ₹4.1 lakh to ₹5.5 lakh monthly, which on its own answers the client’s core question. But I didn’t stop there, because a raw revenue number without explanation invites the follow up question “was that us or just seasonal demand.” So I added a comparison to category level Google Trends data for that skincare subcategory, which showed flat search demand over the same period, meaning the growth genuinely came from ranking improvements, not a rising tide.
Average keyword position for the priority twelve moved from position 14.2 to position 6.8 across the five months, and I pulled three specific keyword examples that moved from page two to the top three results, since a specific example like “vitamin c serum for oily skin moved from position 18 to position 4” lands far better with a non technical reader than an averaged number alone. This is exactly the kind of result that also belongs in your case study library if you’re building out proof of work for future client pitches, since a specific documented win like this is worth far more than a generic “we improved rankings” claim.
I also included a short line connecting the keyword movement directly to the revenue number, something like “these twelve keywords now drive an estimated 41% of organic revenue, up from 22% five months ago.” That single sentence closes the loop between the work being done, the ranking movement, and the actual money the client cares about. Without that connecting sentence, a finance minded reader could still walk away wondering whether the ranking improvements had anything to do with the revenue growth at all.
What I Changed After Client Feedback
The first draft of this report still had a full page channel breakdown showing Google Ads and email performance too, since I’d built it as part of the standard monthly template. The client’s founder said she appreciated it but honestly only looked at the SEO section that month, because that was the specific question on her mind. So the next month, I split it into two documents: a one page “SEO ROI Summary” sent directly to her, and the full channel breakdown sent separately to her marketing manager who actually needed the ad and email detail to do their job.
That change alone, splitting one report into two audience specific versions, cut the founder’s reading time from roughly ten minutes to under two, and she told me directly it was the first report from any agency she’d worked with that she actually finished reading start to finish. If you’re building toward a genuine career in this field rather than just handling one off projects, a structured program like the Alpha Marketer Foundation Program covers this kind of client communication and reporting workflow in far more depth than any single article can, alongside the actual channel execution skills that generate the numbers you’re reporting on in the first place.
Looking back, the biggest lesson from that specific account wasn’t a tactic at all, it was a reminder that reporting is a communication skill first and an analytics skill second. I know marketers who can build a flawless Looker Studio dashboard with perfect attribution modeling, but still lose clients because they never learned to write the two sentences that make a busy founder feel confident about what’s happening with their money. Both skills matter, but if I had to pick one to get right first, it would be the communication side every single time. You can always get more technical later, but a client who’s lost trust in your reporting rarely gives you a second chance to earn it back.
Conclusion
Knowing how to create a digital marketing report step by step really comes down to one shift in thinking: stop building the report to show your work, and start building it to help someone make a decision. Define the goal first, pick a small set of metrics that actually connect to that goal, pull clean data from the right sources, wrap every number in a sentence that explains why it matters, and end with clear recommendations instead of vague next steps. Do that consistently and your reports stop getting the polite “looks good, thanks” and start getting real conversations about what to do next.
If you’re just starting out, don’t try to build the perfect Looker Studio dashboard on your first attempt. Open a spreadsheet, write down the one question your report needs to answer, pick five metrics, and build from there. You’ll get faster and more precise with every single report you write.
And honestly, give yourself permission to redo a report if it doesn’t land the way you expected. I still tweak my own report structure every few months based on what a client actually engages with versus what they scroll past. Reporting isn’t something you master once and repeat forever, it’s a skill you keep sharpening with every account, every awkward question a client asks, and every time you catch yourself explaining a number out loud that should have been explained clearly on the page in the first place.
Before we get into the FAQ section, one last thought. A lot of people treat reporting as the boring administrative task that happens after the real marketing work is done. I’d push back on that framing. The report is often the only piece of your work a client or your manager actually sees directly, and it shapes how they judge everything you’ve done that month, fairly or not. Treating it as a core skill, not an afterthought, changes how seriously you take it, and it shows in the final result.
Frequently Asked Questions
What is a digital marketing report?
A digital marketing report is a document that summarizes campaign or channel performance over a set period, connects that performance to the business goals being tracked, and gives the reader a clear understanding of what happened, why it happened, and what should happen next. It’s not just a list of exported metrics, it’s an interpretation of those metrics for a specific audience. A good one reads less like a spreadsheet export and more like a short, honest update from someone who actually understands the account.
How often should I create a digital marketing report?
Most agencies and in house teams report monthly, since that gives enough time for trends to actually show up in the data without reacting to short term noise. Fast moving paid campaigns often get a lighter weekly check in alongside the full monthly report, while quarterly business reviews summarize the bigger picture for leadership or long term strategy decisions. Weekly reporting on slower moving channels like SEO usually just adds noise without adding useful information.
What tools are best for creating a digital marketing report?
Google Looker Studio is the strongest free option for recurring, automated reports because it connects directly to Google Analytics, Google Ads, and Search Console and refreshes on its own. Excel or Google Sheets works better for custom, one off analysis with calculations those tools don’t handle natively, and Slides or PowerPoint suits live presentations to leadership where storytelling matters more than a self serve dashboard. Most professionals end up using two or even all three, depending on the specific report and audience.
How many metrics should a digital marketing report include?
Five to seven metrics in the main summary is the sweet spot for most audiences. Beyond that number, readers start losing the thread of what actually matters, and the report stops functioning as a decision making tool and starts functioning as a data export. Additional detail can still live in an appendix for readers who want to dig deeper, so you’re not actually losing any information, just organizing it by how urgently the reader needs it.
What’s the difference between a marketing report and a marketing dashboard?
A dashboard is a live, continuously updating view of metrics that someone checks whenever they want current numbers. A report is a fixed snapshot for a specific period with written interpretation and recommendations attached to it. Dashboards are great for day to day monitoring, but reports are what actually drive decisions and conversations, since they include the narrative a dashboard leaves out. Many teams use both together, a dashboard for quick daily glances and a report for the monthly conversation.
Should I include negative results in a digital marketing report?
Yes, always. Hiding a decline or a missed target doesn’t make it go away, it just erodes trust the moment the client or your boss notices it independently, which they usually do. Include the negative number, explain honestly what caused it, and pair it with what you’re doing to fix it. That combination builds more credibility than a report that only shows wins, and it also protects you the moment someone else notices the drop before you’ve had a chance to explain it.
How long should a digital marketing report be?
Length should match the audience, not a fixed rule. A founder or non technical client usually needs one to three pages with a clear executive summary. A marketing manager or technical stakeholder can handle a longer, more detailed breakdown, but even then, keep the main summary tight and push granular data into an appendix rather than the front page. When in doubt, cut length before you cut clarity.
Is Google Data Studio the same as Looker Studio?
Yes, Google rebranded Data Studio as Looker Studio, and the tool functions the same way, connecting to Google Analytics, Google Ads, Search Console, and many third party data sources to build automated, shareable dashboards and reports at no cost for the standard version. Any older tutorial referencing Data Studio still applies, since the interface and connectors carried over with only minor changes.
How do I make a digital marketing report look professional without a designer?
Stick to two or three colors used consistently, use simple bar or line charts instead of cluttered pie charts for anything with more than a few categories, keep fonts consistent throughout, and leave enough white space so the page doesn’t feel crowded. A clean, simple layout almost always reads as more professional than one packed with every visual element a tool offers, because it signals that you made deliberate choices instead of just using every default setting.
What’s the biggest mistake beginners make when creating a digital marketing report?
The biggest mistake is treating the report as a place to display every number available instead of a place to answer a specific question. Beginners often export everything a tool offers and arrange it neatly, without asking what decision the reader actually needs to make. Fixing that single habit improves report quality faster than learning any new tool or template, and it usually happens the moment someone gets direct feedback like “I didn’t understand what this meant.”
Can I automate my digital marketing reports completely?
Data pulling and refreshing can be almost fully automated using tools like Looker Studio’s native connectors or third party connectors like Supermetrics for platforms outside Google’s ecosystem. The written narrative and recommendations section, though, should stay human written, since that interpretation is exactly what separates a useful report from an automated data export. Full automation of the analysis itself usually produces generic summaries that miss the specific context only a human working the account would catch.
What should I do if a client doesn’t respond to my digital marketing report?
Silence usually means the report didn’t clearly answer a question they cared about, or it was too long for them to get through. Follow up with a short, direct message asking one specific question, like whether they’d like to increase budget on the best performing campaign, rather than a generic “let me know your thoughts.” A specific question is far easier to respond to than an open ended one, and it often reveals exactly what part of the report they actually cared about.
Do digital marketing reports need to include competitor data?
Not every month, but including it occasionally, especially in quarterly reports, helps a client understand whether their results reflect genuine performance or just broader market movement. A simple comparison, like your organic traffic growth against category level search demand trends, gives context that a client’s own numbers alone can’t provide, and it’s usually enough without needing a full competitive audit every single reporting cycle.
What’s the best way to present a digital marketing report to a client for the first time?
Send it a day or two before any scheduled call so the client has time to read it on their own first, then use the actual call to walk through the recommendations and answer questions rather than reading the report out loud line by line. First time reports especially benefit from a short verbal walkthrough, since the client hasn’t yet learned how you structure things or which sections matter most to check first.