


A marketing manager at a mid-size D2C brand spent close to eleven lakh rupees on Facebook and Google Ads last quarter. Sales went up, sure. But when the founder asked one simple question in the review meeting, “what did we actually get back from this,” the room went quiet. Nobody had a number. They had impressions, they had click-through rates, they had a folder full of pretty charts, but not one answer to the only question that matters when a budget gets renewed or cut.
That scene plays out in hundreds of marketing meetings every single week, in agencies and in-house teams alike. Everyone tracks likes, reach, followers, and cost per click, and almost nobody ties that spend back to real revenue in a way a CFO would actually accept. Learning how to calculate digital marketing ROI is not a nice-to-have skill for a marketer anymore. It is the thing that decides whether your budget survives the next quarterly review or gets handed to the sales team instead.
Part of the problem is that most marketing dashboards were never built to answer the profit question in the first place. Facebook’s Ads Manager will happily show you a return on ad spend figure that ignores your actual product margin. Google Analytics will show sessions and goal completions without connecting them to what those goals were actually worth after refunds, shipping cost, and payment processing fees ate into the number. Nobody’s lying on purpose, the tools are just measuring the wrong layer of the business by default, and it takes a deliberate step to pull the real profit number out from underneath all that activity data.
This guide walks through the actual math, not the textbook version. You’ll get the formula, the exact steps to pull the right numbers, the tools that make attribution less painful, a channel-by-channel breakdown for SEO, paid ads, email, and social, the mistakes that quietly wreck most ROI calculations, and a full worked example with real numbers so you can see the whole process end to end. By the end, you should be able to walk into any budget meeting and answer the question that shut that marketing manager down.
What You Will Learn in This Guide
Before diving in, here’s a quick map of what’s ahead so you can jump to the part you need right now.
- The exact ROI formula marketers use, and where most people plug in the wrong numbers.
- A five-step process for calculating digital marketing ROI that holds up across channels.
- Which tools actually track attribution correctly, and how to set them up without a data team.
- A channel-by-channel breakdown covering SEO, paid ads, email, and social ROI math.
- The mistakes (like ignoring lifetime value or time lag) that make ROI numbers lie to you.
- A full worked example with real rupee figures, plus what to do once you know your ROI number.
What Digital Marketing ROI Actually Means (And Why Most Teams Get It Wrong)
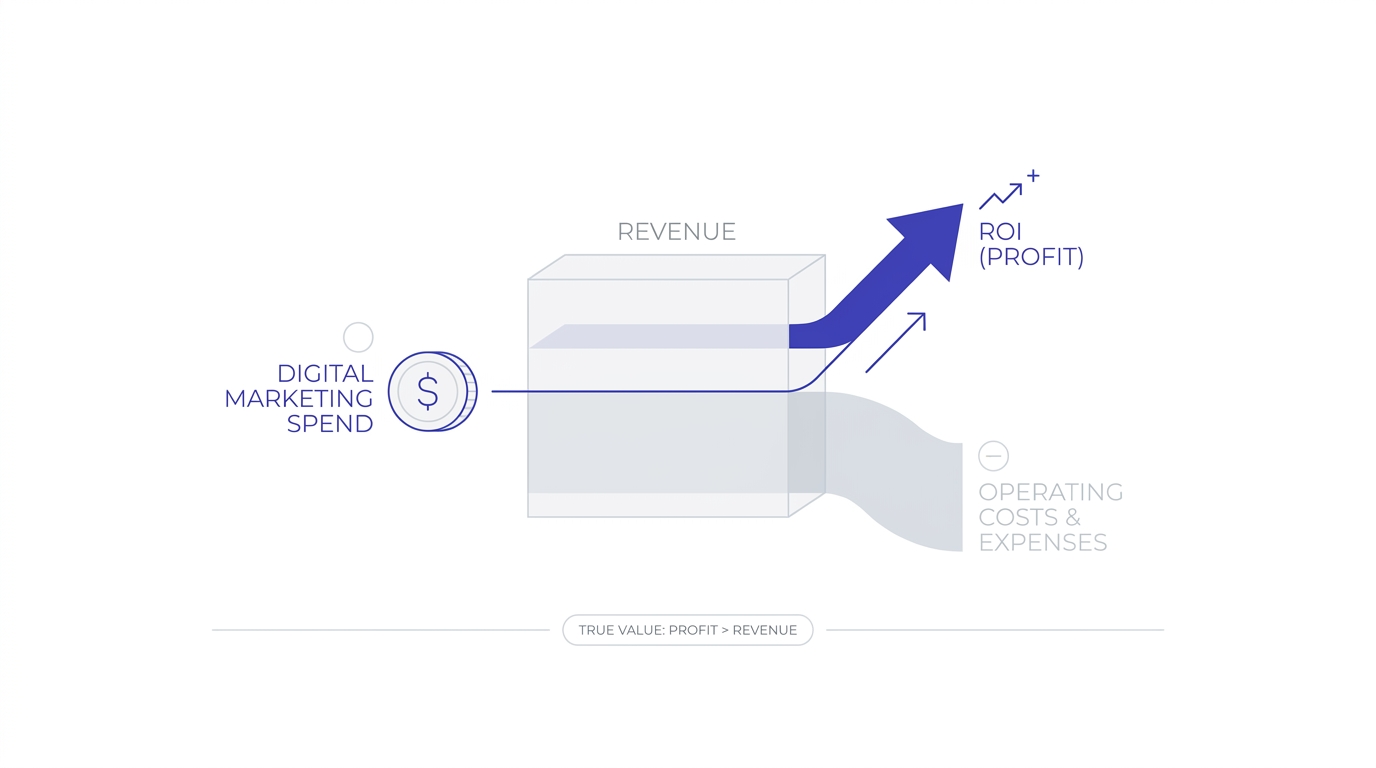
Digital marketing ROI is the percentage return you get on every rupee you spend on marketing, calculated by comparing the profit generated against the total cost of the campaign. That’s it. That’s the whole idea before people start overcomplicating it with dashboards and vanity metrics. If you spend 100 and get back 150 in gross profit, your ROI is 50 percent. Simple in theory, messy in practice, because the tricky part isn’t the formula, it’s figuring out which numbers actually belong in it.
Here’s the thing most guides skip: ROI is a profit measure, not a revenue measure. A campaign that generates 5 lakh in sales but only 40,000 in actual profit margin, after product cost, shipping, and payment gateway fees, has a completely different ROI than one that generates 2 lakh in sales at a 60 percent margin. Teams that report revenue as ROI are technically lying to leadership, even if it’s an accident.
So then why does this mix-up happen so often, even among people who genuinely know better? Mostly because revenue is the number every ad platform surfaces front and center, big, bold, right at the top of the dashboard, while profit requires pulling in a margin figure from finance or an e-commerce backend that marketing doesn’t always have easy access to. The path of least resistance is reporting the number that’s already sitting there in plain sight, even though it’s the wrong one for answering the actual question leadership is asking.
The Basic ROI Formula Explained
The standard formula looks like this: ROI = (Net Profit from Marketing minus Marketing Cost) divided by Marketing Cost, multiplied by 100. Net profit means revenue attributed to the campaign minus the cost of goods sold, not the raw sales figure. Marketing cost means everything spent to generate that result, not just the media budget. Get either of those two numbers wrong and the whole calculation falls apart, no matter how clean your spreadsheet looks.
So if a campaign cost 50,000 rupees in ad spend and generated 2 lakh in revenue at a 40 percent margin, your net profit from that campaign is 80,000. Plug that in: (80,000 minus 50,000) divided by 50,000, times 100, gives you 60 percent ROI. Not 300 percent, which is what you’d get if you sloppily divided revenue by spend instead of profit by spend. That gap between the wrong number and the right one is exactly why finance teams stop trusting marketing reports.
Honestly, this is the single formula worth memorizing out of this entire guide. Write it on a sticky note if you have to. Every other section here, the tools, the channel breakdowns, the mistakes to avoid, exists purely to help you get more accurate inputs into this exact equation. Get the formula right in your head and the rest becomes a data collection problem, not a math problem, which is a much easier thing to solve.
Why ‘Vanity Metrics’ Aren’t ROI
Impressions, likes, shares, and even click-through rate feel like progress, and honestly they can be useful diagnostic signals. But none of them tell you whether the campaign made money. A post can get 50,000 likes and generate zero sales. An ad can get a fantastic click-through rate and still lose money if the landing page doesn’t convert. Confusing engagement with return is probably the single most common reason marketing budgets get cut after a strong-looking quarter.
The fix isn’t to ignore engagement metrics entirely, they still tell you if your creative is landing. The fix is to stop presenting them as if they answer the ROI question. Keep them as a separate diagnostic layer, and reserve the word ROI for the actual profit-over-cost calculation. That distinction alone will make you look more credible in any meeting where budget decisions get made.
Yeah, it’s a little uncomfortable at first, admitting that a campaign everyone celebrated internally actually posted a mediocre ROI once the real math gets applied. But that discomfort is exactly the signal a marketing team needs to get better. Teams that keep two separate reports, one for engagement health and one for actual ROI, tend to make sharper budget calls than teams that blend the two into a single feel-good slide for leadership.
How to Calculate Digital Marketing ROI Step by Step
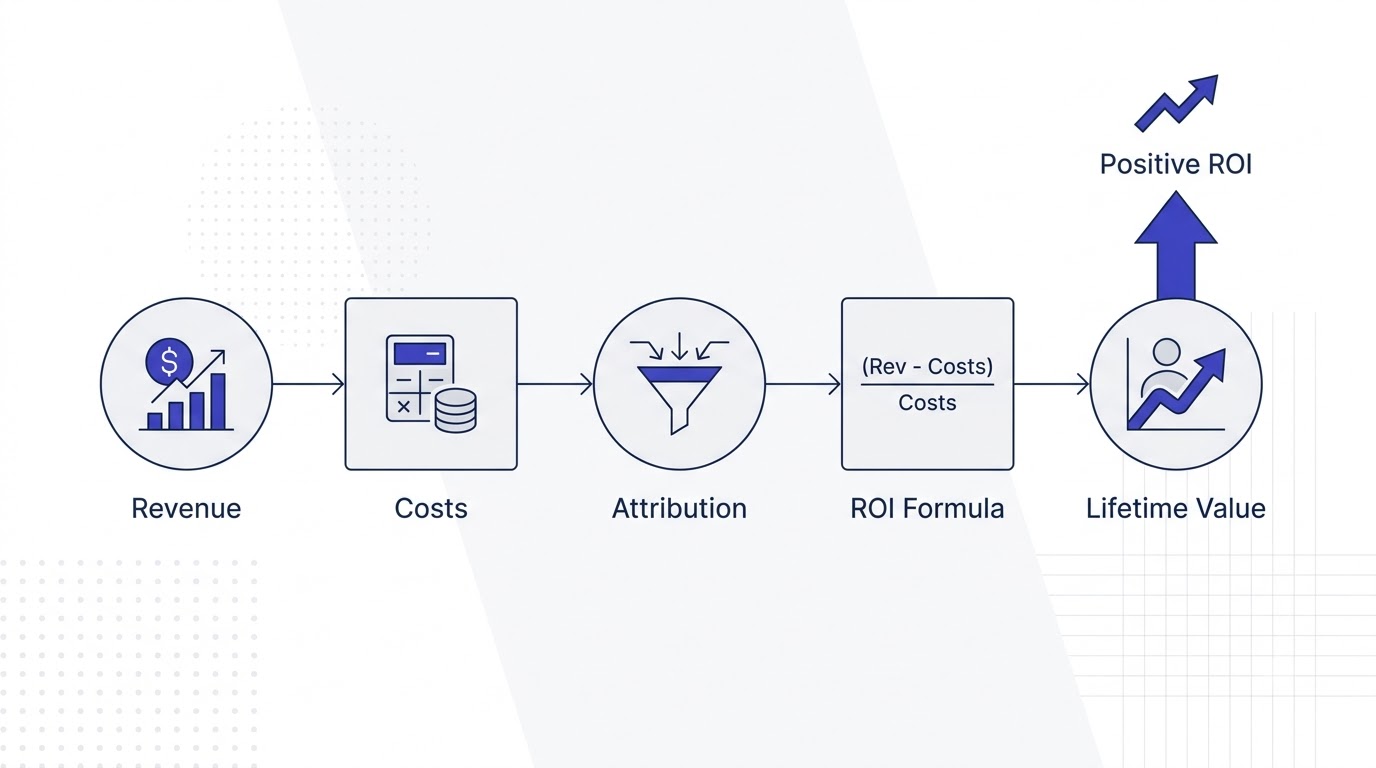
Here’s the actual process, broken into five steps that hold up whether you’re measuring a single campaign or an entire quarter’s marketing spend across five channels. Skip any one of these and your final number will be wrong in a way that’s hard to catch later.
Step 1: Define What Counts as Revenue
Before you calculate anything, decide what actually counts as a conversion for this campaign. Is it a completed purchase, a signed contract, a demo booked, a lead that later closed? For e-commerce this is usually straightforward, a completed order. For B2B it gets murkier because the sale might close four months after the first ad click, through a completely different channel. Write this definition down before you touch a spreadsheet, because changing it halfway through skews every comparison you make later.
A common mistake here is counting every visitor who converted after seeing an ad, even ones who were already going to buy anyway through brand search or direct traffic. That inflates the number attributed to paid campaigns and quietly steals credit from other channels. Decide upfront whether you’re measuring first-touch, last-touch, or a blended attribution model, because that single decision changes which channel looks like the hero and which looks like a waste of budget.
Write this definition into a one-page document and get sign-off from whoever owns the budget conversation, sales lead, founder, whoever it is. Sounds like overkill for a single sentence, but the number of arguments this prevents down the line is worth the five minutes it takes. Nothing derails an ROI review faster than two people arguing about whether a free-trial sign-up should even count as revenue before anyone’s looked at a single dashboard.
Step 2: Track Every Marketing Cost, Not Just Ad Spend
This is where most ROI calculations quietly fall apart. Ad spend is the obvious cost, but it’s rarely the only one. Add in the agency retainer or freelancer fees, the cost of the tools you’re using like Semrush or Mailchimp subscriptions, the design and copywriting hours if you’re paying for them, and any landing page or creative production cost tied specifically to that campaign. Leave those out and your ROI looks a lot healthier than it actually is.
A practical way to handle this: build a simple cost sheet per campaign with rows for media spend, tool costs allocated proportionally, creative production, and labor hours multiplied by an hourly rate even for in-house staff. It feels tedious the first time, but once the template exists you’re just updating numbers each month. Skipping labor cost is the most common shortcut, and it’s the one that makes internal marketing teams look artificially cheap compared to what an agency would charge for the same output.
Here’s a quick gut check that catches most of these gaps. List every person who touched the campaign, the designer, the copywriter, whoever approved the budget and sat in two planning calls, and estimate their hours honestly, even roughly. Multiply by a reasonable hourly rate and add it to the cost sheet. The first time teams do this exercise properly, the fully-loaded cost of a campaign usually comes out 20 to 40 percent higher than what the ad platform’s dashboard alone suggested.
Step 3: Attribute Revenue to the Right Channel
Attribution is where the math gets genuinely hard, because customers rarely convert from a single touchpoint. Someone sees a Facebook ad on Monday, googles the brand name on Wednesday, reads a blog post on Friday, and finally buys through an email link the following Tuesday. Which channel gets credit for that sale? Last-click attribution would hand all the credit to email, which ignores the fact that the Facebook ad started the whole journey.
Most teams start with last-click attribution because it’s the default setting in Google Analytics 4 and it’s easy to explain. That’s fine as a starting point, but it systematically undervalues awareness channels like SEO content and social, and overvalues the channel that happens to close the deal, usually email or branded search. Once you have enough data, moving to a data-driven or position-based model gives a fairer picture, even if it’s harder to explain to a non-marketing stakeholder in one sentence.
Position-based attribution, sometimes called U-shaped, gives 40 percent of the credit to the first touchpoint, 40 percent to the last, and splits the remaining 20 percent across everything in between. It’s not perfect, no model is, but it’s a genuinely reasonable middle ground for a team that isn’t ready to build a full data-driven model yet and doesn’t want to keep starving the top-of-funnel channels of credit they’ve actually earned.
Step 4: Apply the ROI Formula
With revenue defined, costs tallied, and attribution settled, plug the numbers into the formula from earlier: (Net Profit minus Marketing Cost) divided by Marketing Cost, times 100. Do this per channel and per campaign separately, not just as one blended number for the whole quarter. A blended ROI of 80 percent can hide the fact that email is running at 400 percent while a specific paid ad set is bleeding money at negative 30 percent.
Keep a running spreadsheet or dashboard where each row is a campaign, with columns for revenue, cost of goods, net profit, marketing cost, and calculated ROI. Update it monthly at minimum, weekly if you’re running high-spend paid campaigns. The value isn’t just the final percentage, it’s being able to spot the exact week a campaign’s ROI started declining, which is usually your earliest warning that ad fatigue or a landing page issue is creeping in.
Google Sheets works fine for this at a small scale, no need to buy expensive reporting software before you actually need it. What matters more than the tool is the discipline of updating it on schedule instead of reconstructing three months of numbers right before a board meeting, which is when errors creep in and nobody has time left to catch them.
Step 5: Adjust for Time Lag and Customer Lifetime Value
A raw ROI number calculated the same month a campaign runs almost always understates the real return, especially for anything with a longer sales cycle or a subscription-based product. Someone who signs up for a free trial today might not convert to paid for six weeks. If you calculate ROI the month of sign-up using only that month’s revenue, the campaign looks like a loser even though it’s genuinely working, just slower than your reporting window.
The fix is to factor in customer lifetime value, not just the first purchase. A customer acquired through paid ads who spends 1,500 on their first order but sticks around for eighteen months and spends 12,000 total tells a very different ROI story than the first-purchase number alone. Build a rough lifetime value estimate per channel using historical repeat purchase data, and recalculate ROI using that figure whenever you’re deciding whether to scale or kill a channel, not just the first-touch number.
A simple way to start, even without fancy cohort software, is pulling twelve months of order history from your e-commerce platform, grouping customers by their original acquisition source, and averaging total spend per customer within each group. It’s rough, sure, but it’s miles better than judging a channel purely on the transaction that happened the same week the ad was clicked.
The Tools You Need to Calculate Digital Marketing ROI Accurately
You don’t need an enterprise data stack to do this properly. Most small and mid-size teams can get accurate ROI tracking with three tools working together: an analytics platform, a proper UTM tagging system, and a CRM that closes the loop between marketing touch and final sale.
Google Analytics 4 for Attribution
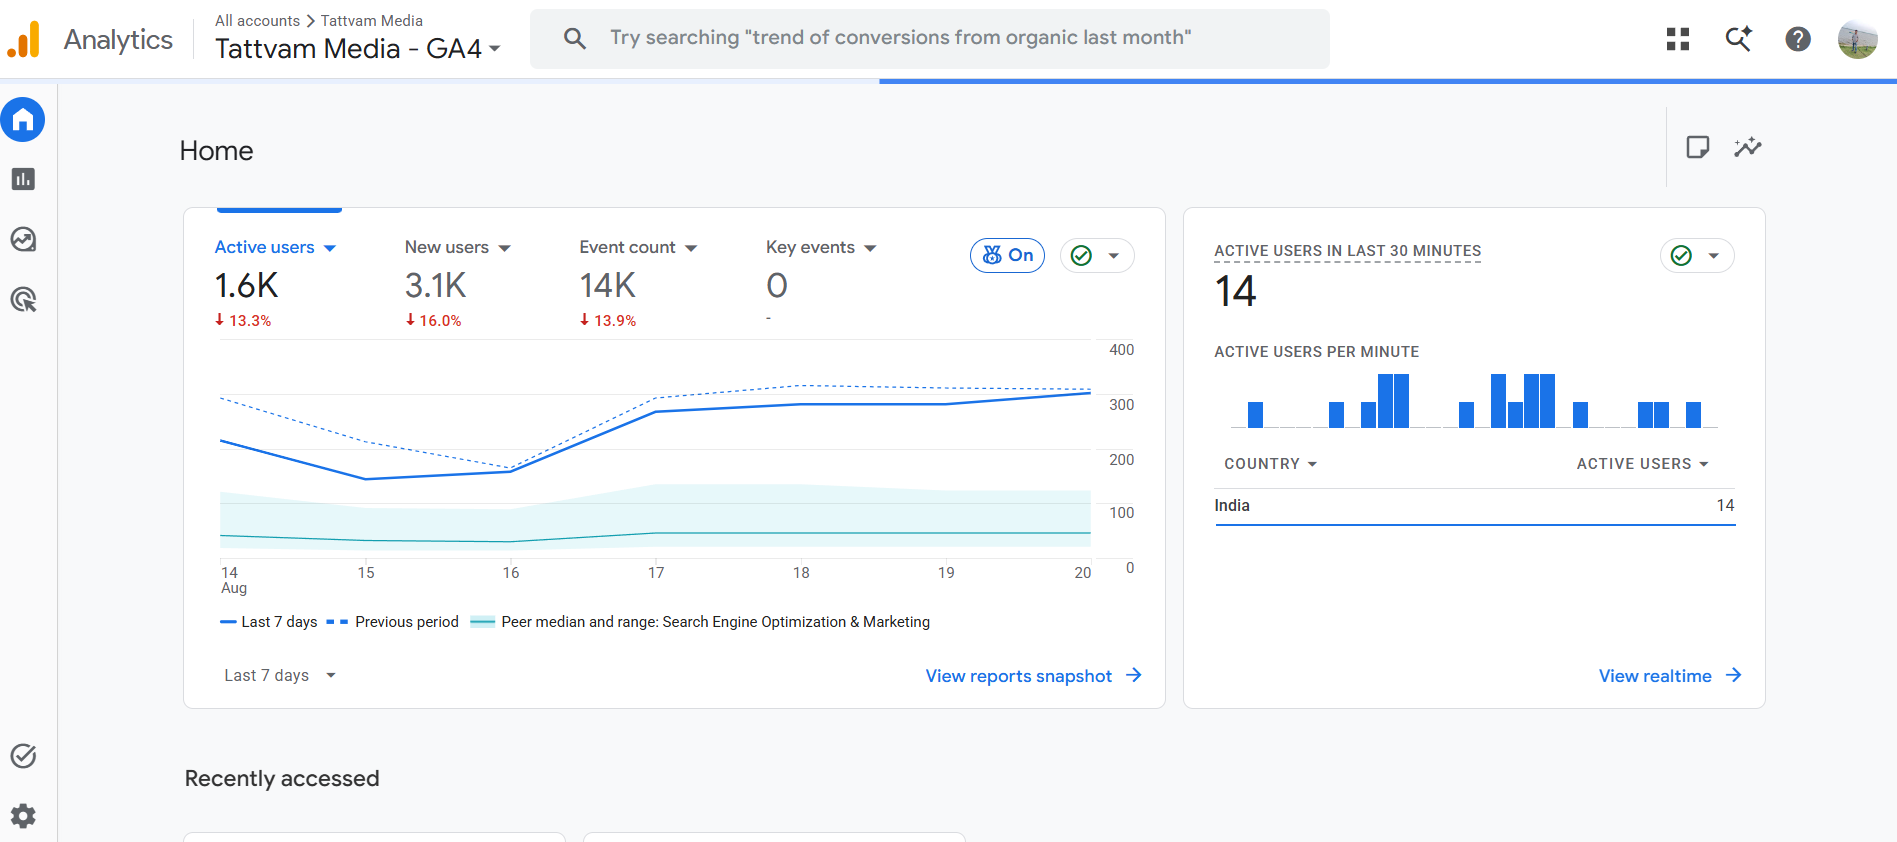
GA4 replaced Universal Analytics and, honestly, the learning curve annoyed a lot of marketers when it rolled out, but its event-based model is actually better suited for ROI tracking once you set it up right. Inside GA4, the Advertising snapshot and the Attribution reports let you compare last-click, first-click, and data-driven models side by side for the same conversion event, which is exactly the comparison you need to make an honest attribution call.
The setup step people skip is marking the right events as conversions. Go into Admin, then Events, and toggle “mark as conversion” only on events that represent real business value, a completed purchase, a qualified lead form, a demo booking. Leaving generic events like scroll depth marked as conversions muddies every ROI report that pulls from GA4 later, because the platform will happily count a scroll as a win if you let it.
It’s worth pairing GA4 with Google Tag Manager rather than hardcoding tracking snippets across every page, since it makes fixing a broken conversion event a five-minute job instead of a developer ticket that sits in a queue for two weeks. A lot of “our ROI dropped suddenly” panics turn out to be a tracking event that silently broke after a website update, not an actual performance problem.
UTM Parameters and Why They Matter
UTM tags are the small pieces of text you add to the end of a URL that tell your analytics platform exactly where a click came from, source, medium, campaign name, and sometimes content variant. Without them, GA4 lumps a lot of your traffic into “direct” or “unassigned,” which is basically a black hole for attribution. A campaign can be quietly working and get zero credit simply because nobody tagged the links.
The mistake most teams make is inconsistent naming, one person tags a campaign as “summer_sale” and another tags the exact same campaign as “Summer-Sale-2026.” GA4 treats those as two separate campaigns, splitting your data and making the ROI for both look worse than it actually is. Build a shared naming convention document before you launch anything, lowercase, no spaces, consistent underscores, and make it mandatory for anyone touching a campaign link.
Google’s Campaign URL Builder is a free, no-login tool that takes two minutes to use and removes most of the manual typo risk. Bookmark it, share it with anyone who launches campaigns, and treat un-tagged links as a launch blocker, not a nice-to-have, because fixing missing UTM data after a campaign has already run is basically impossible.
CRM Data for Closing the Loop
Analytics tools are great at tracking clicks and sessions, but they usually stop at the lead or sign-up stage. To calculate real ROI, especially in B2B, you need to know what happened after that lead entered the CRM, whether it turned into a real closed deal and for how much. Tools like HubSpot or Zoho CRM let you tag each lead with its original UTM source, so when that lead eventually closes six weeks later, you can trace the revenue back to the exact campaign that started it.
Set this up by passing UTM parameters as hidden fields on your lead capture forms, so the source data lands directly in the CRM record instead of getting lost between systems. Then build a simple report that groups closed revenue by original source. This single integration is usually the difference between a marketing team that can defend its budget with real closed-revenue numbers and one that’s still reporting leads as if a lead equals a sale.
If your team is on Zoho CRM, the Campaigns module lets you attach source data directly to a deal record without any custom development work, which makes this achievable even for a two-person marketing team without an in-house engineer. Don’t wait for a perfect data setup before starting, an imperfect source field beats no source field at all.
Channel by Channel: How to Calculate Digital Marketing ROI for Each Platform
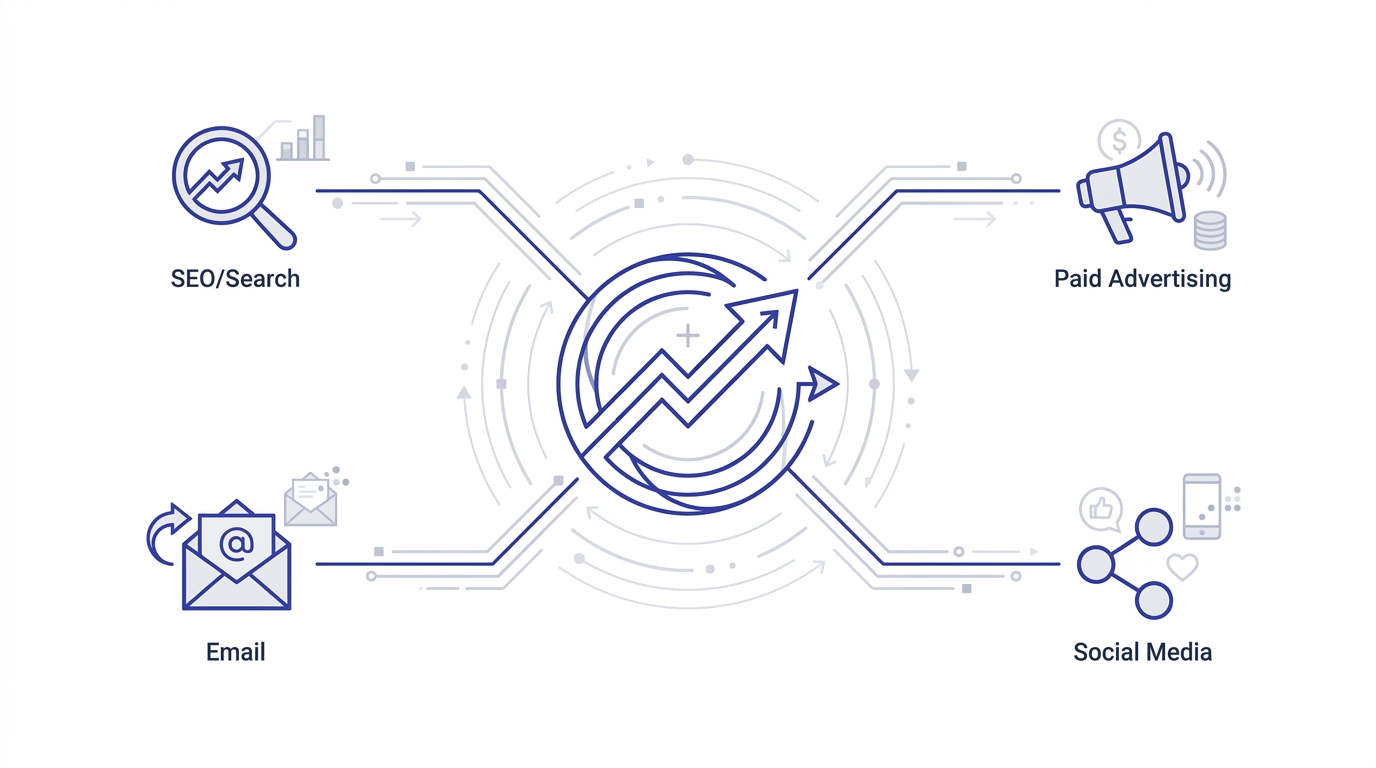
Every channel has its own quirks in how cost and revenue show up, so a single blended formula rarely tells the full story. Here’s how the calculation actually shifts channel by channel.
SEO ROI Calculation
SEO is the trickiest channel to calculate ROI for because the cost is mostly labor and tools spread over months, while the payoff often shows up gradually and keeps compounding long after the work is done. To calculate it, total up content production cost, tool subscriptions like Ahrefs or Semrush, and any technical SEO work over a defined period, then compare that against the revenue from organic search traffic over the same window, ideally using a six to twelve month lag since SEO rarely pays off in month one.
The upside that makes SEO worth the patience: unlike paid ads, organic rankings keep generating traffic and sales without ongoing spend once they’re established, which means the ROI curve keeps climbing for months or years after the initial cost was paid. A blog post that cost 8,000 rupees to produce and ranks for two years, generating say 40 conversions over that time, has a wildly different long-term ROI than a paid ad that stops the second you stop paying for it.
A practical trick here is calculating a rolling twelve-month ROI for your SEO content instead of a single-month snapshot, updating it quarterly as more data comes in. That rolling view is what actually convinces a skeptical finance team that content is worth the ongoing retainer, because the month-one number almost never looks impressive on its own.
Paid Ads (Google Ads, Meta Ads) ROI Calculation
Paid ads give you the cleanest, fastest ROI data of any channel, because the platform tracks cost per click and conversion in near real time. Pull total ad spend for the period, revenue attributed through the platform’s own conversion tracking or, better, through GA4 with proper UTM tagging, and calculate ROI weekly rather than monthly so you can catch a declining campaign before it burns through the whole budget.
The catch with paid ads is return on ad spend, or ROAS, isn’t the same thing as ROI, even though people use them interchangeably all the time. ROAS is revenue divided by ad spend. ROI is profit minus cost, divided by cost. A ROAS of 4x sounds great until you realize your product margin is only 20 percent, at which point that same campaign might actually be losing money once real product cost gets factored in. Always convert ROAS to ROI before presenting it to anyone outside the marketing team.
Inside Google Ads, the Conversion Value column combined with a custom conversion action that only fires on a completed, paid order, not just an add-to-cart, gives the cleanest raw revenue figure to start from. From there it’s just applying your margin percentage to get to real profit, and then the ROI formula does the rest of the work.
Email Marketing ROI Calculation
Email consistently posts some of the highest ROI numbers of any channel, partly because the cost is genuinely low, a Mailchimp or Klaviyo subscription plus the time to write and design campaigns, and partly because you’re marketing to people who already know your brand. Calculate it by totaling platform cost plus content production time, then comparing against revenue from email-attributed conversions using UTM-tagged links inside every campaign send.
The mistake that inflates email ROI artificially is crediting a sale to email just because the customer happened to click an email link on their way to a purchase they were already planning to make, sometimes called “warm list cannibalization.” A cleaner read compares revenue from email against a control group who didn’t receive the campaign, when list size allows for it, so you’re measuring incremental lift, not just activity that would have happened anyway.
Klaviyo’s built-in revenue attribution report already segments this reasonably well for e-commerce brands, breaking out flow revenue from campaign revenue automatically. Even a rough holdout group of five to ten percent of the list who gets excluded from a promotional send is usually enough to sanity check whether email is genuinely driving incremental sales or just riding along with demand that already existed.
Social Media ROI Calculation
Organic social is the hardest channel to defend with hard ROI numbers because a huge chunk of its value is brand awareness and trust building that shows up in other channels later, not direct conversions on the platform itself. To calculate it fairly, track cost, content creation time, management tools, occasional paid boosting, against both direct conversions from tagged links in bio or stories and assisted conversions where social was a touchpoint earlier in the customer journey.
Don’t try to force organic social into the same tight ROI box as paid ads. It’s genuinely fine, and honest, to report organic social ROI alongside a secondary metric like assisted conversions or branded search lift, because forcing a direct-attribution-only view on a channel built for discovery and trust will always make it look worse than it actually is, and that’s how good social strategies get killed by a spreadsheet that wasn’t built to measure them properly.
One workaround worth trying is tracking branded search volume alongside your social posting calendar. A spike in people googling your brand name the same week a piece of content goes semi-viral is a real signal of influence, even if GA4 can’t draw a clean line from the post to a specific purchase. It won’t slot neatly into the ROI formula, but it belongs in the same conversation when someone questions the value of the channel.
Mistakes That Wreck Digital Marketing ROI Calculations
Even teams that know the formula cold still end up with wrong numbers because of a handful of recurring mistakes. Here are the three that show up most often.
Ignoring Customer Lifetime Value
Calculating ROI purely on the first transaction undervalues every channel that’s good at acquiring loyal, repeat customers and overvalues channels that are good at one-time impulse buys. A paid ad campaign that looks mediocre on first-purchase ROI might actually be your best channel once you factor in that customers from that source buy again three times more often than average. Pull historical repeat-purchase data by acquisition source at least once a quarter and use it to sanity-check any decision to cut a channel based on first-purchase numbers alone.
This mistake shows up most brutally in referral-heavy businesses, where a customer acquired through a slightly more expensive channel ends up referring three friends over the following year. None of that referred revenue gets credited back to the original channel in a standard ROI report, which means the channel that actually built your customer base can look like your worst performer on paper.
Not Accounting for Time Lag
Judging a campaign’s ROI in the same reporting window it launched in is one of the fastest ways to kill something that just needed more time. B2B deals with long sales cycles, high-ticket purchases, and even SEO content all take weeks or months to convert. Cutting a channel because month-one ROI looked flat, without checking whether conversions are simply still in the pipeline, is how good long-term strategies get axed for short-term reporting convenience.
A simple fix is checking your CRM’s average deal cycle length before setting an ROI reporting window in the first place. If deals typically take eight weeks to close, judging a campaign’s ROI at the four-week mark will always understate it, no matter how well the campaign is actually doing behind the scenes.
Mixing Up Correlation With Attribution
Just because sales went up during the same month a campaign ran doesn’t mean that campaign caused it. Seasonality, a competitor’s price increase, a viral moment that had nothing to do with your marketing, all of these can inflate revenue at the same time a campaign happens to be live. Before crediting a channel with a big ROI number, check whether the lift shows up specifically among people who were exposed to that campaign, using UTM-tagged conversion data, not just a general “sales went up this month” observation.
A good habit is checking year-over-year data for the same period before celebrating a strong monthly number. If sales always spike in October because of a festive season regardless of what marketing does, crediting that entire lift to a single campaign launched that same month is going to badly overstate its real ROI.
Advanced Digital Marketing ROI Metrics Worth Tracking
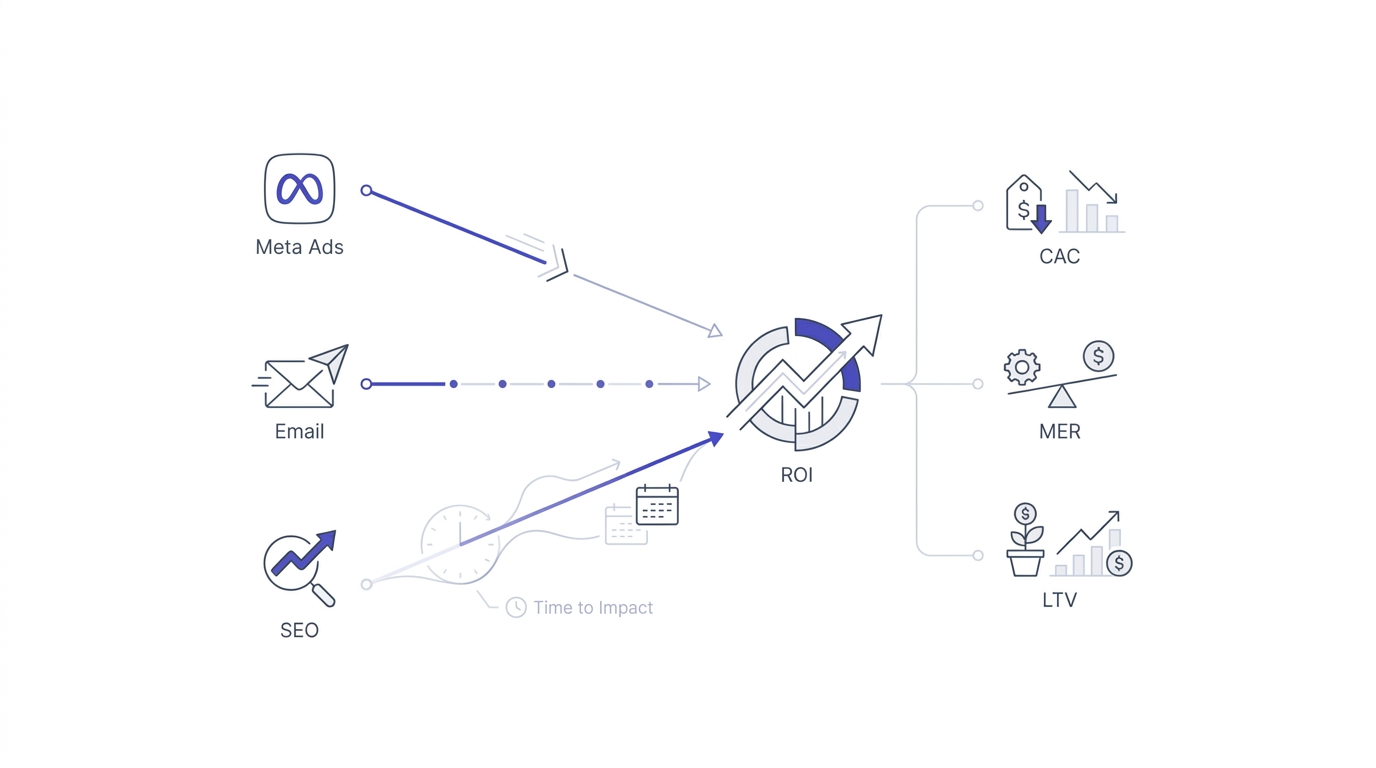
Once the basic ROI formula is second nature, a few supporting metrics make the picture sharper and help you make better budget decisions.
Customer Acquisition Cost (CAC)
CAC is total marketing and sales spend divided by the number of new customers acquired in that period. It’s not the same as ROI, but it’s a critical companion metric because a channel can post a healthy ROI percentage while still having a CAC that’s climbing every month, a sign that the channel is getting more expensive to run even if it’s still technically profitable. Track CAC alongside ROI on a monthly basis, and treat a rising CAC as an early warning even when ROI still looks fine on paper.
A useful pairing here is comparing CAC against customer lifetime value, sometimes shortened to the LTV to CAC ratio. A ratio of 3:1 or higher is generally considered healthy across most industries, meaning a customer is worth at least three times what it costs to acquire them. Below that, even a channel with positive short-term ROI might not be sustainable once you factor in overhead and churn.
Marketing Efficiency Ratio (MER)
MER is total revenue divided by total marketing spend across all channels combined, giving you a single blended efficiency number that’s harder to game through attribution tricks than channel-level ROI. It’s a useful sanity check: if your per-channel ROI numbers all look great individually but your overall MER is flat or declining, something in your attribution setup is likely double-counting revenue across channels, which happens more often than most teams realize.
MER is also a lot less sensitive to the attribution model you pick, since it just looks at total business revenue against total spend, no channel-splitting required. That makes it a good number to track week to week even before your channel-level attribution setup is fully sorted out, as a rough temperature check on whether marketing overall is moving in the right direction.
Blended vs Channel-Specific ROI
Blended ROI looks at total marketing spend against total revenue with no channel breakdown, useful for a quick executive summary but useless for deciding where to actually put next quarter’s budget. Channel-specific ROI breaks it down per platform and campaign, which is where the real decisions get made. Report both, but never let a healthy blended number hide a specific channel that’s quietly bleeding money underneath it.
A practical habit is presenting blended ROI first in any stakeholder meeting to set overall context, then immediately following it with a channel-by-channel table so nobody walks away thinking every channel is performing equally. Leadership tends to remember whichever number they hear first, so lead with the one that’s honest about the full picture, not just the flattering headline figure.
A Real-World Example: Calculating Digital Marketing ROI for a Small Business
Numbers make this concrete faster than any framework, so here’s a walkthrough using a fictional but realistic small skincare brand running a one-month campaign across three channels.
The brand spent 60,000 rupees on Meta Ads, 25,000 on email marketing tools and design time, and 40,000 on an SEO retainer that month. Total marketing cost: 1,25,000. Over that month plus a two-month tracking window to account for lag, Meta Ads generated 3,10,000 in attributed revenue, email generated 1,80,000, and SEO generated 90,000 in organic revenue, much of it from content published months earlier now starting to rank.
The brand’s average product margin sits at 45 percent. So net profit from Meta Ads is 3,10,000 times 0.45, which is 1,39,500. Subtract the 60,000 spend: net gain of 79,500. ROI: 79,500 divided by 60,000, times 100, equals roughly 132 percent. Email: 1,80,000 times 0.45 is 81,000 net profit, minus 25,000 cost, gives 56,000 net gain, an ROI of 224 percent. SEO: 90,000 times 0.45 is 40,500, minus 40,000 cost, gives just 500 net gain, an ROI of barely 1 percent for that specific month, even though the actual content driving it will keep earning for the next year without any additional spend.
Look at what that example actually shows. Email posted the best ROI by a wide margin for the least spend, which is typical. Meta Ads was solidly profitable but far more expensive to run. SEO looked almost break-even for that single month, but judging it on that one month alone would be a mistake, because none of that 40,000 retainer cost needs to be spent again for that same content to keep earning next month and the month after. That’s exactly the kind of nuance a single blended ROI number would completely hide.
Now stretch the same SEO number out three months instead of one, holding cost flat since the content is already published and needs no fresh spend, and assume organic revenue holds steady at 90,000 a month as rankings mature. Three months of 90,000 is 2,70,000 in revenue against that same single 40,000 retainer cost already spent. Net profit at 45 percent margin comes to 1,21,500, minus the 40,000 cost, for a net gain of 81,500. Suddenly SEO’s ROI over the same content jumps to roughly 204 percent, right up there with email. That’s the entire argument for judging content-driven channels over a longer window instead of killing them after one unimpressive month.
This is also where the blended ROI number for the whole month becomes genuinely useful as a sanity check. Total cost across all three channels was 1,25,000. Total net profit was 79,500 plus 56,000 plus 500, which comes to 1,36,000. Blended ROI for the month sits at roughly 109 percent, a healthy number on the surface, but one that would have completely hidden the fact that SEO needed patience rather than a budget cut, and that Meta Ads, while profitable, was costing more than twice what email cost to generate a smaller net gain.
How to Improve Digital Marketing ROI Once You Know the Number
Calculating ROI is only useful if it changes what you actually do next. Here’s how to act on the numbers once you have them.
Cutting Underperforming Channels
If a channel has posted negative or barely-positive ROI for three consecutive reporting periods, after accounting for time lag and lifetime value, it’s usually time to pause it rather than keep hoping the next month turns it around. Before cutting entirely, try one diagnostic pass first, check whether the issue is the channel itself or the landing page and offer, since a genuinely good channel can look terrible if the page it’s sending traffic to is broken or unconvincing.
Run a quick heatmap check with a free tool like Microsoft Clarity before pulling the plug on a channel entirely. If traffic is landing but nobody’s scrolling past the first fold or the checkout button is buried, the channel isn’t the problem, the page is, and fixing that page might turn a negative ROI channel into your best performer without spending a rupee more on media.
Doubling Down on What Works
Once a channel shows consistently strong ROI over a proper measurement window, the instinct should be to scale it, but do it gradually. Increasing budget by 20 to 30 percent at a time and watching whether ROI holds steady, rather than tripling spend overnight, protects you from hitting audience saturation too fast, where cost per acquisition starts climbing sharply once you’ve exhausted the easiest-to-convert segment of your audience.
Keep a close eye on frequency metrics inside Meta Ads Manager or Google Ads while scaling, since a climbing frequency number alongside a falling ROI is usually the clearest early sign that the same audience is seeing the ad too often. At that point, fresh creative or a new audience segment matters more than more budget.
Testing Before Scaling Budget
Before committing serious budget to any channel, run a smaller test campaign specifically designed to validate ROI at low stakes, a couple of weeks and a modest spend, before rolling it into the main budget plan. This is especially important for channels you haven’t used before, since your first attempt at a new platform, whether that’s Pinterest ads or LinkedIn sponsored content, almost never performs at the same level your optimized campaigns on familiar channels do.
A good rule of thumb: cap the initial test at no more than 10 percent of what you’d spend on a fully committed campaign, and set a clear go or no-go ROI threshold before the test even starts. Deciding the bar for success after seeing the numbers is how teams talk themselves into scaling something that never should have made it past the test phase.
None of this needs to happen all at once. Pick the channel that’s eating the biggest chunk of the budget right now, build the cost sheet for it this week, and calculate one honest ROI number before moving on to the next channel. Teams that try to overhaul their entire measurement system in one sprint usually burn out halfway through and go back to guessing. Teams that fix one channel at a time end up with a full, reliable picture within a quarter, without anyone having to become a data analyst overnight.
Getting comfortable with how to calculate digital marketing ROI changes the entire conversation you have about budget. Instead of defending spend with impressions and reach, you walk into that meeting with a real number, backed by a formula, tracked consistently, and adjusted for the things that actually matter like margin, lifetime value, and time lag. That’s the difference between a marketing team that gets trusted with a bigger budget next quarter and one that spends every review meeting justifying its existence. Start with one channel this month, build the cost sheet, tag your links properly, and run the calculation for real instead of estimating it.
Digital Marketing ROI Benchmarks Worth Comparing Against
A raw ROI number in isolation doesn’t tell you much until it’s compared against something realistic for your industry. A 60 percent ROI might be excellent for a high-competition category like insurance or legal services, and mediocre for a low-competition local business. Here’s a rough sense of how benchmarks shift across a few common business types, useful as a starting reference, not a strict rulebook.
E-commerce ROI Benchmarks
E-commerce brands typically aim for a blended ROAS of around 4x to 5x, which translates to roughly 60 to 100 percent ROI once a typical 30 to 40 percent product margin is applied. Categories with thinner margins, like grocery or low-cost fashion, often need a higher ROAS just to hit the same ROI percentage as a higher-margin category like skincare or supplements, so comparing raw ROAS across product categories without adjusting for margin is a common way teams misjudge performance.
Repeat purchase rate matters more here than almost any other factor. A brand with a 25 percent repeat purchase rate within ninety days can afford a much lower first-purchase ROI than a brand that’s mostly one-and-done, because the lifetime value math closes the gap over time. Always check repeat rate before deciding a channel’s first-purchase ROI is too low to justify the spend.
B2B and SaaS ROI Benchmarks
B2B and SaaS businesses usually measure success with a much longer window, often ninety days or more, and expect a lower immediate ROI in exchange for a much higher lifetime value per customer once a deal closes. A common benchmark here is a five to one ratio of customer lifetime value to customer acquisition cost, rather than a monthly ROI percentage, since deal cycles are too long and irregular for a tight monthly number to be meaningful.
The channels that tend to look weakest on short-window ROI in B2B, content marketing and SEO especially, are often the strongest once measured over a full year, because they build the kind of trust that shortens the sales cycle for every deal that comes after the first one closes. Judge B2B content spend on a rolling annual basis, not a monthly snapshot.
Local and Service-Based Business ROI Benchmarks
Local businesses, clinics, salons, home services, tend to see the fastest and most direct ROI from Google Business Profile optimization and local search ads, since intent is already high by the time someone searches “plumber near me.” A well-run local campaign can post ROI well above 200 percent because the cost per lead is low and conversion rates from local intent searches run much higher than generic awareness campaigns.
The trap for local businesses is treating a single strong month as the new normal and scaling budget too fast, when local search volume is often seasonal or tied to a limited geographic pool of customers that eventually gets saturated. Track ROI over a rolling six-month window for local campaigns before assuming a great result will keep repeating indefinitely.
Reviews also do more heavy lifting for local ROI than most owners give them credit for. A jump from a 3.8 to a 4.5 star rating on Google Business Profile can lift conversion rate on the exact same ad spend without touching the budget at all, which means a chunk of “marketing” ROI improvement for local businesses actually comes from customer service and review generation, not from the ad campaign itself.
How to Report Digital Marketing ROI to Stakeholders Who Aren’t Marketers
Knowing how to calculate digital marketing ROI is only half the job. Presenting it in a way a founder, CFO, or non-marketing stakeholder actually trusts and acts on is the other half, and it’s the part most marketers get wrong by drowning the number in jargon nobody outside the team understands.
Lead With One Number, Not a Dashboard
Walking into a budget meeting with fifteen charts and a wall of metrics is a common instinct, and it almost always backfires. Lead with a single headline ROI figure for the period, stated in plain terms, this quarter’s marketing spend returned this much profit, and only then offer the channel breakdown and supporting charts for anyone who wants to dig deeper. Stakeholders remember the one number you lead with far more than anything buried on slide nine.
Practice saying the number out loud before the meeting. If it takes more than one sentence to explain what the ROI figure actually measures, simplify the explanation further, because a number that needs a paragraph of caveats before anyone can trust it stops functioning as a headline metric at all.
Translate ROI Into Business Language
A CFO doesn’t think in click-through rate or cost per mille, they think in rupees spent, rupees returned, and payback period. Translate every marketing metric into that language before presenting it. Instead of saying “our CAC improved 12 percent,” say “we’re now paying 12 percent less to acquire each new customer, which adds roughly this much to quarterly profit at current volume.” Same fact, completely different level of buy-in.
This translation step is where most marketing teams lose credibility without realizing it. Jargon that sounds precise inside the marketing team sounds evasive to someone outside it, like the number is being dressed up to avoid a direct answer. Direct rupee language, even when the news isn’t great, builds more trust over time than a polished metric that nobody outside marketing fully understands.
Show the Trend, Not Just the Snapshot
A single month’s ROI number, good or bad, tells a stakeholder almost nothing about direction. Always show at least a three to six month trend line alongside the current figure, so a dip reads as context within a bigger pattern instead of triggering a panic decision to slash a channel that’s actually on an upward trajectory. A declining ROI over four straight months is a real signal. A single soft month sandwiched between two strong ones is just normal variance.
Frequently Asked Questions
What is a good ROI for digital marketing?
A commonly used benchmark is a 5:1 ratio of revenue to marketing cost, which translates to roughly 400 percent ROI when calculated on profit rather than raw revenue. Anything below 2:1 usually signals the campaign isn’t covering its true costs once overhead and product margin are factored in. That said, a good ROI varies heavily by industry, margin structure, and channel, so treat these as starting benchmarks, not universal rules.
What is the formula for digital marketing ROI?
The formula is: ROI equals net profit from marketing minus marketing cost, divided by marketing cost, multiplied by 100. Net profit means revenue attributed to the campaign after subtracting cost of goods sold, not the raw sales figure. Marketing cost should include ad spend, tools, labor, and creative production, not just the media budget.
How is ROAS different from ROI in digital marketing?
ROAS, or return on ad spend, is simply revenue divided by ad spend, and it ignores profit margin entirely. ROI factors in the actual profit after product cost and all marketing expenses, giving a truer picture of whether a campaign made money. A high ROAS can still mean a losing campaign if the product margin is thin, so ROI is the more reliable number for budget decisions.
How long should you wait before calculating digital marketing ROI?
For fast-converting channels like paid ads on impulse-purchase products, a week or two of data is usually enough for a rough read. For B2B, SEO, and higher-ticket purchases, wait at least six to twelve weeks to account for the natural lag between first touch and final conversion, otherwise the ROI number will look artificially weak.
Can you calculate ROI for organic social media?
Yes, though it’s harder than paid channels because a lot of organic social’s value is indirect brand awareness rather than immediate conversions. Track direct conversions from tagged links plus assisted conversions where social appeared earlier in the customer journey, and treat the resulting number as directionally useful rather than perfectly precise.
What tools are best for tracking digital marketing ROI?
Google Analytics 4 for attribution and conversion tracking, a consistent UTM tagging system for source data, and a CRM like HubSpot or Zoho to close the loop between marketing touch and final closed revenue form a solid stack for most small and mid-size teams without needing enterprise-level analytics software.
Why does my marketing ROI look different in every report?
This usually comes down to inconsistent attribution models, different reporting windows, or mismatched UTM naming conventions across campaigns. Standardize your attribution model, reporting period, and UTM naming rules across the whole team, and the numbers across different reports should start lining up.
Should I include labor cost when calculating digital marketing ROI?
Yes. Skipping labor cost, whether that’s an in-house marketer’s hours or an agency retainer, makes in-house campaigns look artificially profitable compared to their real cost. Assign an hourly rate to internal time spent on a campaign and include it in the total marketing cost for an honest ROI figure.
What is customer lifetime value and why does it matter for ROI?
Customer lifetime value is the total revenue a customer generates across their entire relationship with a brand, not just their first purchase. Including it in ROI calculations reveals channels that acquire loyal, repeat customers even if their first-purchase ROI looks average, which changes which channels deserve more budget.
What’s the difference between blended and channel-specific ROI?
Blended ROI compares total marketing spend against total revenue with no breakdown by channel, giving a quick overall efficiency snapshot. Channel-specific ROI breaks the same calculation down per platform and campaign, which is what actually informs where to allocate next quarter’s budget, since a healthy blended number can still hide an underperforming individual channel.
Is negative ROI always a reason to cut a marketing channel?
Not always. Check whether the channel is still within its natural conversion time lag, whether lifetime value would change the picture, and whether the issue is actually the landing page or offer rather than the channel itself. If negative ROI persists across three full reporting cycles after accounting for those factors, it’s usually time to pause or rework the channel.
How often should digital marketing ROI be calculated?
Paid channels with fast conversion cycles benefit from weekly ROI checks so declining performance gets caught early. Slower channels like SEO and email are usually fine on a monthly cadence, with a deeper quarterly review that factors in lifetime value and time lag adjustments across every channel.