


Most website owners find out something is broken on their site by accident. A friend mentions the contact form didn’t work. Sales dip for three weeks and nobody notices until the founder asks why revenue looks off. That’s the cost of not knowing how to track website traffic and user behavior properly. Not a vague, “we should probably check analytics sometime” cost. A real one, measured in visitors who showed up, got confused, and left without anyone on the team ever knowing it happened.
Here’s the thing that trips up almost everyone starting out: traffic numbers and behavior numbers are not the same story. A site can pull in 40,000 visitors a month and still be quietly failing, because those visitors land, scroll for four seconds, and bounce. Traffic tells you who showed up. Behavior tells you what they did once they got there, and behavior is where the real answers live. Ranking on page one of Google means nothing if the page underneath that ranking can’t hold attention.
This guide walks through how to track website traffic and user behavior the way it’s actually done on live sites, not the theory version. That means setting up Google Analytics 4 correctly (most people install it wrong), reading heatmaps and session recordings without misreading them, building event tracking that captures the actions that matter, and knowing which numbers to check every week versus which ones are just noise. Everything below assumes zero prior analytics experience, and every term gets explained the first time it shows up.
What You Will Learn in This Guide
- The real difference between traffic data and behavior data, and why mixing them up leads to bad decisions
- How to set up Google Analytics 4 from scratch and which reports actually matter
- How heatmaps and session recordings expose problems that traffic numbers never will
- How to track specific events like clicks, form submissions, and scroll depth
- The exact mistakes that make tracking data useless, and how to avoid them
- A simple weekly routine for checking traffic and behavior data without drowning in dashboards
How to Track Website Traffic and User Behavior: The Core Difference
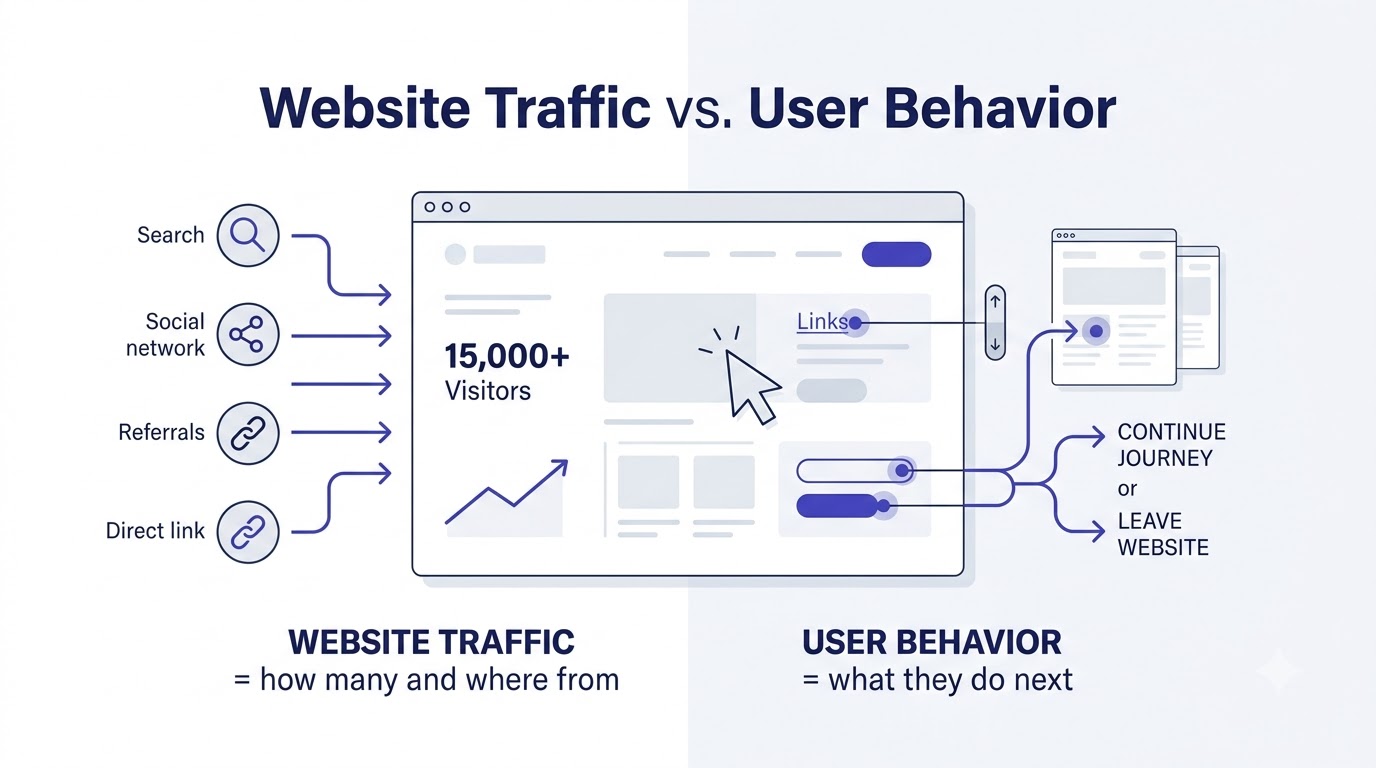
Website traffic and user behavior get lumped together constantly, and that’s the root of most bad marketing decisions. Traffic is the count: how many people arrived, where they came from, what device they used. Behavior is the story: what those people clicked, how far they scrolled, where they got stuck, and why they left. A site can win on one and lose on the other, and if you’re only watching the traffic number, you’ll never know the second problem exists.
Website Traffic vs User Behavior: What’s the Difference
Traffic data answers “how many” and “from where.” It’s the visitor count, the split between organic search, paid ads, and social, and the device breakdown between mobile and desktop. This is the data most beginners check first because it’s the easiest to understand: a bigger number feels like a win. Google Analytics calls this “acquisition” data, and it’s the starting point for any tracking setup, but it’s only half the picture.
Behavior data answers “what happened next.” Once someone lands on a page, what did they actually do? Did they scroll to the pricing section or bounce in the first five seconds? Did they click the “Buy Now” button, or did they click somewhere that wasn’t even a button because they assumed it was one (this happens far more than people expect, and it’s called a “dead click” or “rage click” depending on how many times they tried)? This is engagement data, and it needs a different kind of tool to capture properly. GA4 handles some of it. Heatmap tools handle the rest.
Mixing these two up leads to a specific, very common mistake: a marketing team celebrates a traffic spike from a viral post, checks nothing else, and never notices that 95% of that traffic bounced within eight seconds because the landing page took forever to load. The traffic number went up. The business outcome didn’t move an inch.
Why Tracking Both Matters for Growth Decisions
Growth decisions made off traffic data alone are decisions made half-blind. Say organic traffic to a blog post grows 30% month over month. Good news on paper. But if the average session duration on that page is 12 seconds and the bounce rate sits at 88%, that traffic growth isn’t translating into anything useful, no email signups, no product page visits, nothing. The behavior data is what tells the team the page needs a rewrite, not a bigger ad budget.
The reverse happens too. A page with modest, unremarkable traffic (say 800 visits a month) might have a 6-minute average session duration and a 40% scroll-to-bottom rate, meaning the handful of people who find it are genuinely reading and engaging. That page is a candidate for more promotion, more internal links, more attention, and traffic data alone would never surface it because the volume looks unimpressive.
Anyone learning SEO fundamentals needs to internalize this early: ranking is the acquisition half of the job. What happens after the click is a completely separate skill, and it’s the half that actually determines whether the ranking was worth the effort.
How to Track Website Traffic and User Behavior With Google Analytics 4
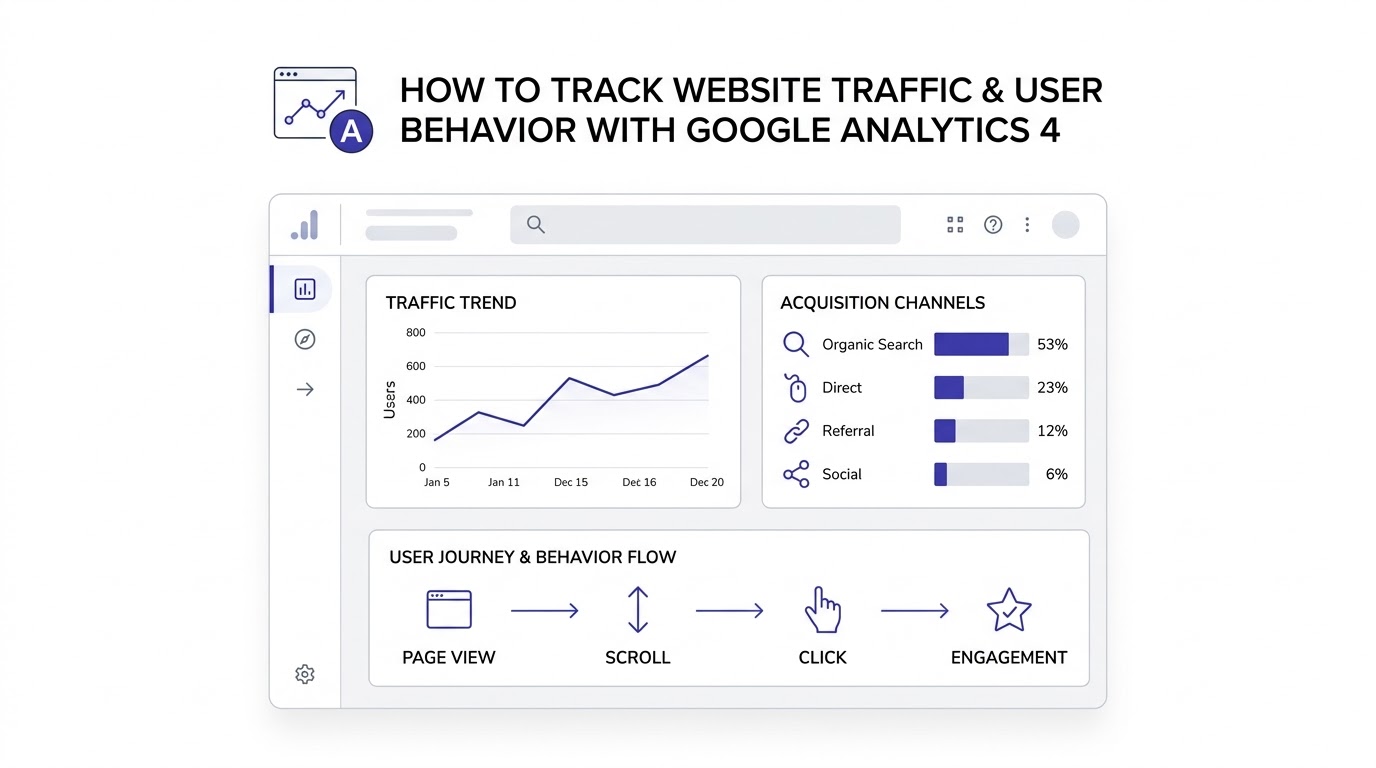
Google Analytics 4 is the free, standard tool for tracking website traffic and user behavior, and it should be the very first thing installed on any new site. It replaced Universal Analytics back in 2023, and it works on an entirely different data model: event-based instead of session-based. That change confuses a lot of people migrating over, so it’s worth explaining plainly. In the old system, everything revolved around “pageviews” and “sessions.” In GA4, everything is an “event,” a click, a scroll, a pageview, a form submission, a video play, all logged as events with parameters attached. This sounds like a small technical detail, but it’s actually the reason GA4 can track behavior so much better than its predecessor could.
Creating a GA4 Property and Installing the Tracking Code
Setting this up starts at analytics.google.com. Create an account, then create a “property” inside that account (a property maps to one website or app). During setup, GA4 asks for basic business details: industry category, business size, and what the intended use is, reporting, measuring conversions, understanding customer journeys. Pick the ones that actually apply; this affects which suggested reports show up later, not much else.
The part that actually matters is the installation step. GA4 generates a Measurement ID (it looks like G-XXXXXXXXXX), and that ID needs to reach every page on the site. There are three common ways to do this: paste the GA4 tag directly into the site’s <head> section, use Google Tag Manager (the more scalable option once tracking needs grow past the basics), or use a plugin if the site runs on WordPress, like Site Kit by Google. Google Tag Manager is worth the extra 20 minutes of setup time for anyone planning to add event tracking later, because it avoids editing site code every single time a new tag needs adding.
The mistake most beginners make here: installing the code, checking that “Realtime” shows visitors, and assuming the job is done. Realtime showing a pulse just confirms the tag fired. It says nothing about whether Key Events (GA4’s term for conversions, more on that later) are configured, whether internal traffic is being filtered out, or whether the data retention settings are even keeping data long enough to be useful. GA4’s default data retention for event-level data is set to 2 months unless it’s manually changed to 14 months in Admin settings, and almost nobody checks that setting until they need to compare year-over-year data and find out it’s gone.
Reading the Traffic Acquisition Report
The Acquisition report, found under Reports in the left sidebar, is where the “how many and from where” question gets answered. It breaks visitors down by channel: Organic Search, Direct, Paid Search, Organic Social, Referral, and Email. Each channel behaves differently and needs to be read differently, not just summed into one big traffic number.
Organic Search traffic reflects SEO work paying off, or not. Direct traffic (people typing the URL straight in or using a bookmark) usually signals brand recognition, though it also catches some tracking gaps, like links from apps that strip referral data. Referral traffic shows other sites sending visitors, which matters for spotting which partnerships or guest posts are actually converting into real visits versus just looking good on a media kit.
The report most people skip entirely is the comparison between channels on Engagement Rate, not just session count. A channel bringing in 5,000 sessions a month with a 20% engagement rate is doing worse than a channel bringing in 800 sessions with a 65% engagement rate, even though the raw number looks smaller. Engagement rate in GA4 measures the percentage of sessions that lasted longer than 10 seconds, had a conversion event, or had 2+ pageviews, a decent proxy for “did this visit actually go somewhere.”
Reading the Engagement and Behavior Reports in GA4
Past Acquisition, the Engagement reports (Pages and Screens, Events, Landing Page) are where behavior tracking actually starts. The Pages and Screens report shows which URLs get the most views, but the number that matters more is Average Engagement Time per page, which is a much better read on quality than raw pageviews. A page with high views and low engagement time is getting found but not read.
The Events report lists every event firing on the site, and by default GA4 auto-tracks a handful: page_view, scroll (fires once a user hits 90% depth), click (for outbound links), and a few others. This is useful but shallow. Anyone serious about learning how to track website traffic and user behavior needs to go past the auto-tracked events into custom ones, which gets covered in detail in the events section further down this guide.
How to Track Website Traffic and User Behavior Using Heatmaps and Session Recordings
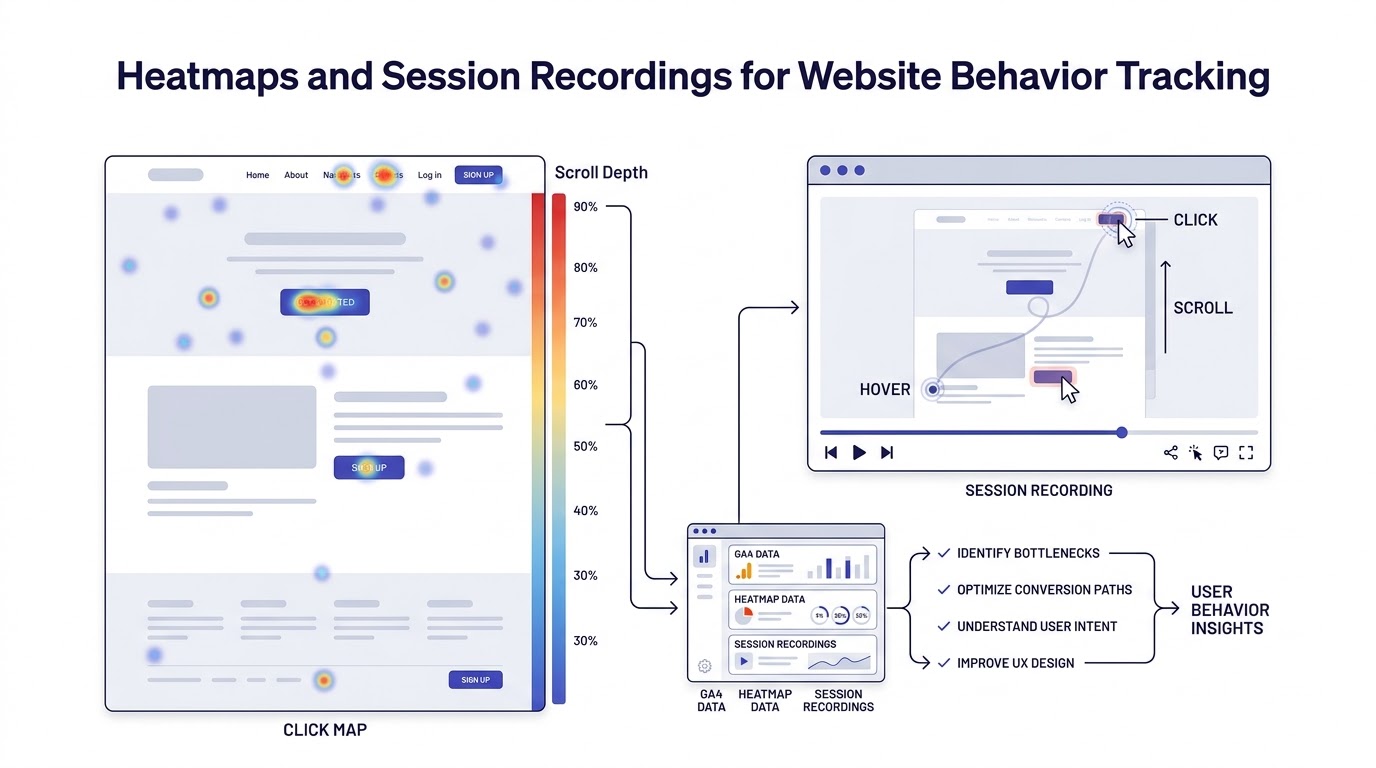
Numbers in GA4 tell part of the story, but they’re abstract. A 62% bounce rate on a landing page is a fact, not an explanation. Heatmaps and session recordings fill that gap by showing exactly what visitors did on the page, visually, one click and one scroll at a time. This is the part of tracking that most beginners skip because it feels less “official” than a spreadsheet full of percentages, but honestly, it’s often more useful for fixing an actual problem.
Setting Up Heatmaps with Microsoft Clarity or Hotjar
Microsoft Clarity is free, unlimited, and takes about ten minutes to install: sign up at clarity.microsoft.com, create a project, paste the tracking script into the site’s <head> (or install via Google Tag Manager), and data starts collecting within a few hours. Hotjar works similarly but caps free-tier sessions, so most people starting out lean toward Clarity first, then move to Hotjar later if the site needs more advanced filtering.
Once installed, three heatmap types show up: click maps (where people are clicking, shown as a heat overlay, red for hot zones, blue for cold), scroll maps (how far down the page people actually scroll before leaving), and area maps (which sections of the page get the most attention). Click maps are the one that catches problems fastest. It’s common to open a click map and see a bright red cluster on something that isn’t even clickable, an image, a bolded headline, a phone number written as plain text instead of a tel: link. That’s a “dead click,” and it means visitors expected an interaction that never happened. Fix that one thing, and conversion rate on that page often moves without touching a single word of copy.
Scroll maps expose a different problem: content depth mismatch. If the scroll map shows 80% of visitors never make it past the first screen, but the pricing table sits three screens down, that pricing table is invisible to most of the audience no matter how good it is. This is the kind of finding that traffic reports never surface, because traffic reports don’t know or care what’s physically on the page.
Watching Session Recordings the Right Way
Session recordings are literal video playback of a single visitor’s mouse movement, clicks, and scrolling, anonymized (no personal data, just cursor behavior). Both Clarity and Hotjar record these automatically once installed. Watching one recording tells you almost nothing. Watching twenty from the same page tells you a lot, because patterns emerge: three separate visitors all hesitate at the same form field, or five different people all try to click a menu item that doesn’t expand on mobile.
The mistake most people make here is watching recordings randomly instead of filtering them. Clarity and Hotjar both let recordings be filtered by “Rage Clicks” (multiple rapid clicks on the same spot, a strong signal of frustration) or by specific pages and device types. Filtering to just the checkout page on mobile, for example, surfaces the exact friction points costing revenue, instead of wading through recordings of visitors calmly reading a blog post with zero issues.
A recurring pattern worth watching for specifically: visitors who open a form, fill in the first two fields, then abandon it entirely. That’s not a traffic problem or an SEO problem. That’s a form design problem, too many required fields, a confusing label, an error message that doesn’t explain what went wrong, and it only shows up on video, never in a spreadsheet.
Combining Heatmap Data With Analytics Numbers
Heatmaps and GA4 numbers answer different questions, and the real insight shows up when they get read together, not separately. Say GA4 shows a landing page with a 70% bounce rate. That number alone doesn’t say why. Pull up the scroll map for that same page and if it shows most visitors scrolling zero pixels before leaving, the problem is almost certainly above-the-fold: a slow-loading hero image, a confusing headline, or a page that doesn’t load correctly on mobile. If the scroll map instead shows deep scrolling with high engagement, but the bounce rate is still high, the issue is more likely that visitors read the content, got their answer, and left satisfied, which is a completely different (and less alarming) story than the first scenario.
For anyone recommending tools to a client, a team, or students learning this workflow, this is exactly the kind of comparison worth documenting in a proper tools comparison guide, since Clarity, Hotjar, and paid alternatives like FullStory each handle filtering and session limits differently, and the right pick depends on traffic volume and budget.
Setting Up Goals, Events, and Conversion Tracking for Deeper Behavior Insights
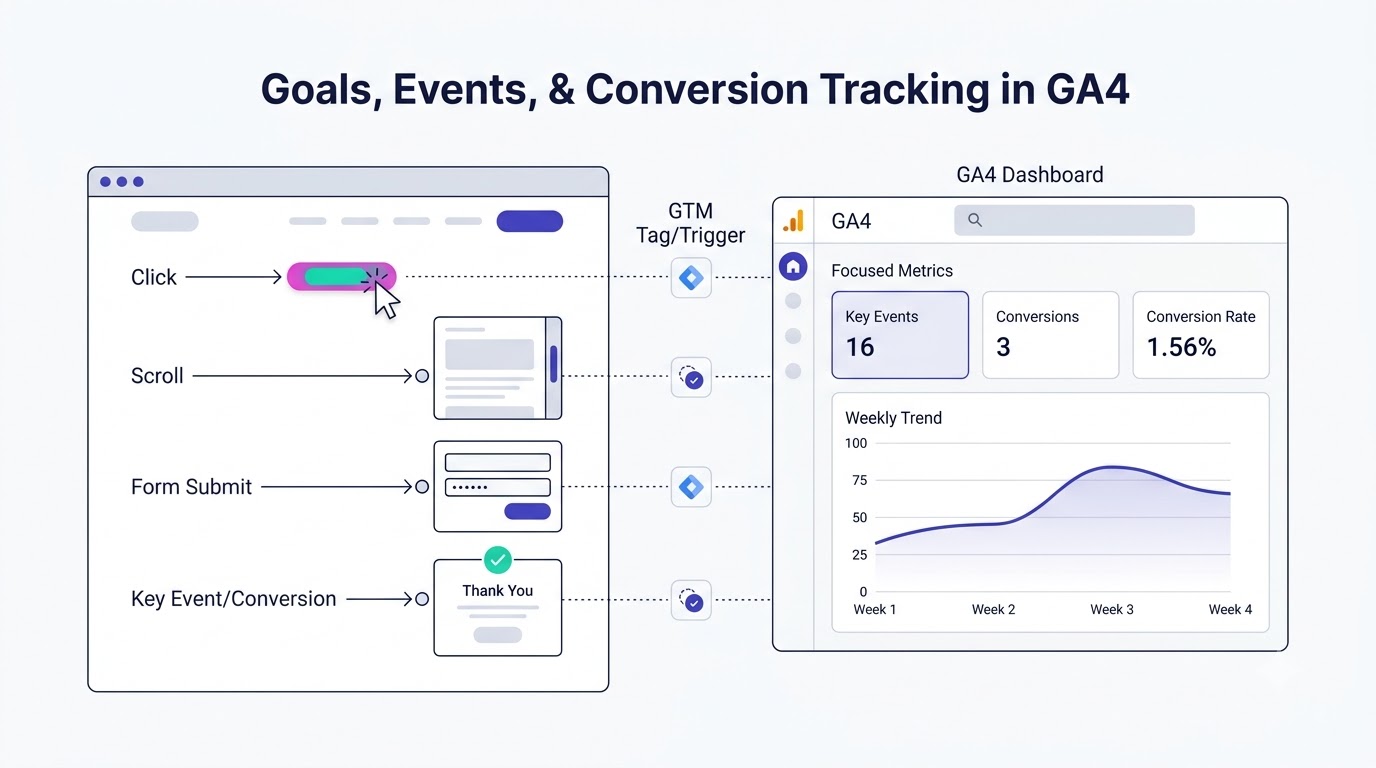
Traffic and heatmap data show what’s happening broadly. Event tracking is what makes tracking specific: instead of “engagement rate went up,” it becomes “form submissions from the pricing page increased 18% after the CTA button color changed.” That specificity is the entire point of learning how to track website traffic and user behavior properly, because vague metrics don’t drive decisions, specific ones do.
Setting Up Key Events in GA4
GA4 calls conversions “Key Events.” Some come pre-built (like a purchase event for ecommerce sites using standard tracking), but most sites need to mark their own events as key manually. The path is Admin > Events > toggle “Mark as key event” next to whichever custom event matters, a newsletter signup, a demo request, a PDF download.
Before marking something as a key event, it has to exist as an event first. This is done through Google Tag Manager for most non-developers: create a new tag, choose the trigger (a button click, a form submission, a specific URL visited as a “thank you” page), and connect it to a GA4 Event tag that sends the data through. It sounds technical the first time, but it’s a repeatable five-step process once it’s done once. Anyone building this out for the first time genuinely benefits from a structured walkthrough rather than trial and error, which is part of why web development fundamentals get taught alongside analytics setup rather than as a separate, unrelated skill.
The mistake to watch for: marking too many things as key events. If every button click and every scroll gets flagged as a “conversion,” the Key Events report turns into noise, and it becomes impossible to tell which actions actually correlate with revenue or leads. Three to five key events per site is a reasonable range for most small to mid-sized businesses.
Tracking Scroll Depth, Clicks, and Form Submissions
Scroll depth tracking answers whether people are reading content or bailing early. GA4’s auto-tracked scroll event only fires at 90% depth, which is too blunt for real analysis. Setting up custom scroll triggers in Google Tag Manager at 25%, 50%, 75%, and 90% gives a much clearer read on where attention drops off, useful for long-form content especially, since a page can rank well and still lose most readers by the second section.
Click tracking on specific elements, like a “Download Case Study” button or an outbound link to a partner site, needs its own trigger set up in Tag Manager targeting the element’s CSS class or ID. This is where it becomes possible to answer questions like “does the blue CTA button outperform the green one” with actual data instead of a guess.
Form submission tracking is arguably the highest-value event to set up correctly, because forms are usually where leads and signups happen. The common error: tracking the form submission on page load of a “thank you” page instead of the actual submit action. This inflates numbers, because anyone who reaches that thank-you page by navigating directly (bookmark, back button, refreshing) gets counted as a new submission even if they didn’t actually submit anything. A cleaner setup fires the event directly off the form’s submit action, tied to a successful response, not just a page visit.
Building a Simple Weekly Tracking Dashboard
All this data means nothing if nobody looks at it consistently. A weekly dashboard doesn’t need to be complicated, GA4’s “Explore” section lets custom reports get built and saved, pulling together traffic source, key events, and engagement rate into one view that takes two minutes to scan every Monday morning.
A workable weekly routine looks like this: check total sessions and channel split for anomalies (a sudden 40% drop usually means a tracking break, not an actual traffic collapse, so check the tag before panicking), review key event completions against the previous week, and pull one or two session recordings from the highest-traffic page to spot-check for new friction points. That’s it. Fifteen minutes, done consistently, beats a comprehensive quarterly report that nobody reads until something’s already gone wrong.
Mistakes When You Track Website Traffic and User Behavior
Even with the right tools installed, tracking data goes bad in predictable, repeatable ways. Most of these mistakes don’t announce themselves, the dashboard still looks fine, the numbers still populate, but the conclusions drawn from them end up wrong.
Tracking Everything But Analyzing Nothing
This is the single most common failure pattern. A site gets GA4, Clarity, and maybe a third tool installed, dashboards get built, and then nobody actually opens them on a schedule. Data collection without a review habit is functionally the same as having no tracking at all, except it costs more effort and creates false confidence, “we track everything,” said by someone who hasn’t checked a report in four months.
The fix isn’t more tools. It’s a calendar reminder and a five-metric checklist reviewed weekly: sessions by channel, engagement rate, key event completions, top exit pages, and one heatmap or recording spot-check. Small, consistent, boring. That’s what actually works, not a 40-tab spreadsheet built once and abandoned.
Ignoring Bot Traffic and Internal Visits
Traffic numbers get inflated by two sources most beginners never filter out: bot traffic and internal team visits. GA4 does filter known bots automatically through the IAB/ABC International Spiders and Bots List, but it doesn’t catch everything, and it definitely doesn’t filter out the marketing team refreshing the homepage forty times a day to check a new headline.
Internal traffic filtering is set up under Admin > Data Streams > Configure Tag Settings > Define Internal Traffic, matching by IP address (office IP, home IP for remote teams). Skipping this step means every internal visit, every developer testing a new page, every marketer previewing a draft, quietly pads the session count and skews engagement metrics, especially on lower-traffic sites where a handful of internal visits can shift the percentages noticeably.
Not Segmenting Data by Traffic Source or Device
A blended average hides more than it reveals. A site might show a 3.2% overall conversion rate, which sounds fine, until it’s segmented and it turns out organic search converts at 5.1% while paid social converts at 0.4%, dragging the average down and masking a real problem with the paid campaign. Nobody spots that by looking at the top-line number alone.
Device segmentation catches a different, equally common issue: mobile bounce rates running significantly higher than desktop, usually pointing to a slow mobile load time or a layout that breaks on smaller screens. GA4’s comparison feature (the “+” next to any report) makes this kind of segmentation quick to set up, comparing mobile vs desktop, or new vs returning users, directly inside any existing report rather than exporting to a spreadsheet. This is also where real, documented examples matter more than theory, the kind of before-and-after breakdown that shows up in a proper case study rather than a generic checklist, because seeing the actual segmented numbers from a real site makes the pattern click faster than any explanation does.
For teams building this kind of tracking discipline into a broader skill set rather than a one-off task, a structured program like the Web Development Mastery Program covers the technical implementation side, tag management, event setup, site speed, that most standalone analytics tutorials gloss over.
Conclusion
Learning how to track website traffic and user behavior isn’t really about collecting more data. It’s about collecting the right data and actually looking at it on a schedule instead of letting a dashboard sit untouched. Traffic numbers show up first because they’re the easiest to check, but the behavior data, the scroll maps, the session recordings, the specific events tied to real actions, is where the actual answers to “why isn’t this converting” live. Get GA4 installed correctly, layer a heatmap tool on top of it, set up a handful of key events that actually matter, and build a fifteen-minute weekly habit around checking all three. That combination catches problems traffic numbers alone will never reveal, and it turns analytics from a report nobody reads into a tool that actually changes decisions.
Frequently Asked Questions
What is the difference between tracking website traffic and tracking user behavior?
Website traffic tracking measures volume and source, how many visitors arrived and where they came from. User behavior tracking measures what those visitors did once they landed, including clicks, scroll depth, time on page, and form interactions. Traffic tools like Google Analytics 4 handle the first, while heatmap and session recording tools handle the second, and both are needed for a complete picture.
Is Google Analytics 4 free to use?
Yes, Google Analytics 4 is completely free for standard use, with no cap on the number of websites tracked. There’s a paid enterprise version called GA4 360 built for very large organizations needing higher data limits and dedicated support, but it’s unnecessary for the vast majority of small business and personal sites.
How long does it take for Google Analytics 4 to start showing data?
Realtime data usually appears within minutes of installing the GA4 tracking code correctly. Standard reports, however, can take 24 to 48 hours to populate fully, since GA4 processes data in batches rather than instantly for most report types. Historical trend reports need at least a few weeks of collected data before patterns become genuinely meaningful.
What’s the best free tool for heatmaps and session recordings?
Microsoft Clarity is currently the strongest free option, offering unlimited heatmaps and session recordings with no traffic cap. Hotjar also offers a free tier but limits the number of sessions recorded per month, making it a better fit once budget allows an upgrade to a paid plan for higher-traffic sites.
Why does my bounce rate look different in GA4 compared to Universal Analytics?
GA4 measures engagement differently than the old Universal Analytics model. Instead of bounce rate as the primary metric, GA4 emphasizes “engagement rate,” the percentage of sessions lasting over 10 seconds, including a conversion event, or with 2 or more pageviews. A GA4 bounce rate (the inverse of engagement rate) will almost always read lower than what Universal Analytics reported for the same traffic, because the calculation methods aren’t equivalent.
How do I track form submissions if I’m not a developer?
Google Tag Manager makes this possible without writing code. A trigger gets set up to fire on the form’s submit action, connected to a GA4 event tag that logs the submission. Many form builders (like WPForms or Gravity Forms on WordPress) also offer built-in GA4 integrations that skip the manual tag setup entirely, making it a reasonable starting point for non-technical site owners.
What is a rage click and why does it matter?
A rage click happens when a visitor clicks the same spot on a page rapidly, multiple times in a short window, almost always out of frustration that nothing is responding. It’s a strong signal of a broken button, a slow-loading element, or a section that looks clickable but isn’t. Heatmap tools like Microsoft Clarity flag these automatically, making them one of the fastest ways to spot a UX problem without manually reviewing dozens of recordings.
Should I track internal team visits separately from real visitor traffic?
Yes, internal visits should be filtered out entirely, not just tracked separately. Team members previewing drafts, testing new features, or refreshing pages during work can meaningfully inflate session counts and distort engagement metrics, especially on lower-traffic sites. GA4 allows this filtering through the Internal Traffic settings under Data Streams configuration, matched by known office or remote IP addresses.
How many key events should a small business track in GA4?
Most small to mid-sized sites do best with three to five key events, covering the actions that most directly connect to revenue or lead generation, such as a purchase, a demo request, or a newsletter signup. Marking too many actions as key events dilutes the report and makes it harder to tell which behaviors genuinely correlate with business outcomes.
Is a high traffic number always a good sign?
No, a high traffic number without strong engagement is often a warning sign rather than a win. Traffic that arrives and immediately bounces without scrolling, clicking, or converting usually points to a mismatch between what the content promised (often through a headline or ad) and what the page actually delivers. Behavior data, not the traffic count, determines whether that visitor volume is actually valuable.
Can I track user behavior without installing any code on my site?
Not really. Every reliable behavior tracking tool, including GA4, Microsoft Clarity, and Hotjar, requires a small tracking script installed on the site, either directly in the code or through a tag management system like Google Tag Manager. Some website builders and CMS platforms simplify this into a plugin or built-in integration, but the underlying script still needs to load on every page to collect data.
What’s a reasonable engagement rate to aim for?
Engagement rate benchmarks vary heavily by industry and page type, but a rate below 40% on key landing pages usually signals a content or design mismatch worth investigating. Blog content and long-form guides often perform better, sometimes reaching 60 to 70%, because visitors arriving through search tend to read more before leaving compared to visitors landing on a generic homepage.