


A marketing manager once walked into a monthly review with a slide that had 40,000 impressions, 3,200 page views, 900 social shares, and a client on the other side of the table asking one question: “So what did we actually get out of this?” Silence. Nobody in that room could answer, because every number on that slide was a metric, and not one of them was a KPI.
That scene plays out in agencies and in-house teams every single month, and it is the exact reason so many people search for digital marketing metrics vs KPIs without really knowing what they are looking for. They know something is off. Reports are packed with numbers, dashboards look busy, and yet leadership still asks whether the marketing spend is working. The gap is not a data problem. It is a definition problem. Metrics and KPIs get treated as interchangeable words when they are doing two completely different jobs.
A metric is just a measurement. It tells you what happened. A KPI, short for Key Performance Indicator, is a metric that has been tied directly to a business goal, given a target, and assigned to someone who owns it. Every KPI is a metric, but not every metric deserves to be a KPI, and that one sentence is the whole article compressed into one line.
Think about a D2C skincare brand running Instagram ads for a new serum. The ad account shows 1.2 lakh impressions, a 3.8 percent engagement rate, and 15,000 reach in the first week. Everyone on the team feels good. Then the founder checks Shopify and finds 22 orders came in that week, at a cost per order that eats almost the entire margin on the product. Two completely different pictures existed side by side, one built from metrics that looked healthy, one built from the KPI, revenue per ad rupee spent, that actually decided whether the campaign kept running.
That gap between “the numbers look fine” and “the business result is fine” is where most marketing reporting breaks down, and it happens because nobody drew a clear line between what to measure and what to be judged on. This guide walks through the actual difference between digital marketing metrics vs KPIs, why teams keep mixing them up, a practical framework for turning raw metrics into real KPIs, how this plays out differently across SEO, paid ads, social, and email, and the mistakes that quietly wreck most KPI dashboards. By the end, picking the right numbers to report on and the right numbers to ignore should feel a lot less confusing.
What You Will Learn in This Guide
- The exact definition of a metric versus a KPI, with a simple test to tell them apart in five seconds
- Why vanity metrics sneak into dashboards disguised as KPIs, and how to spot them
- A four-step framework for converting any raw metric into a working KPI
- Channel-specific breakdowns for SEO, paid advertising, social media, and email marketing
- The most common mistakes teams make when setting digital marketing KPIs, and practical fixes for each one
- Answers to the questions people actually search when researching this topic
Digital Marketing Metrics vs KPIs
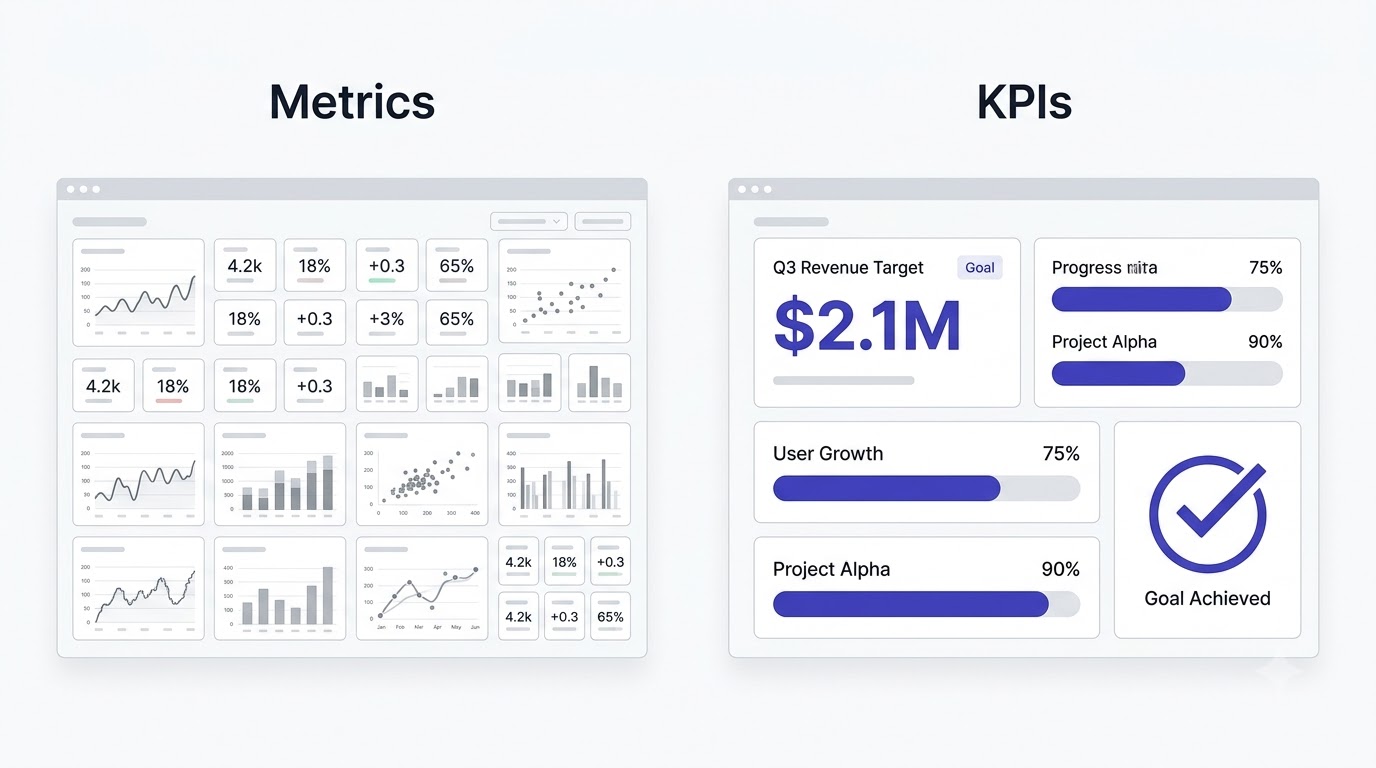
Before going any deeper, it helps to nail down what each term actually means on its own, because most confusion starts right here at the definition stage. People assume metric and KPI are just two words for the same thing, and that assumption is where every messy report begins.
What Exactly Is a Metric in Digital Marketing
A metric is any number that gets tracked. Page views, bounce rate, impressions, click-through rate, average session duration, follower count, email open rate, cost per click. All of it counts as a metric. Metrics exist in the hundreds inside any analytics tool, and Google Analytics 4 alone tracks well over a hundred different data points across acquisition, engagement, and conversion categories.
Metrics are descriptive. They describe what happened during a campaign, on a page, or across a channel. A metric on its own does not tell you whether that number is good, bad, or worth acting on. Ten thousand impressions sounds impressive until you find out the ad ran in front of an audience that has zero interest in the product. The number is real, the insight is not.
Metrics are also cheap to collect. Almost every platform, whether it is Google Analytics, Meta Ads Manager, HubSpot, or Mailchimp, throws metrics at you the moment a campaign goes live. That is exactly the trap. Because metrics are so easy to pull, teams default to reporting whatever the dashboard shows instead of deciding in advance what actually matters.
There is nothing wrong with metrics by themselves. A good marketer actually needs dozens of them running in the background, quietly, as diagnostic tools. Scroll depth tells you whether people are actually reading a landing page or bouncing after the hero section. Time on page tells you whether a blog post is holding attention. Exit rate on a checkout page flags a friction point before it turns into lost revenue. None of these belong on a leadership report as a headline number, but every single one of them is genuinely useful when a KPI moves in the wrong direction and someone needs to figure out why.
The trouble starts only when this diagnostic layer gets confused with the decision layer. A weekly team huddle checking scroll depth and exit rate to fix a page is a completely healthy use of metrics. A quarterly board meeting where scroll depth gets presented as evidence the marketing team is performing well is a misuse of the exact same number, because scroll depth was never designed to answer that kind of business question.
What Exactly Is a KPI in Digital Marketing
A KPI is a metric with a job to do. It has been selected on purpose because it directly reflects progress toward a specific business goal, and it usually comes with a target number and a deadline attached to it. Cost per acquisition under 500 rupees by the end of the quarter is a KPI. Impressions is not, unless brand awareness is the actual, stated business goal and someone has set a target impression count tied to a media budget.
The difference is intent. Nobody wakes up and decides bounce rate should be tracked for its own sake. A team decides that reducing bounce rate on the pricing page from 68 percent to under 40 percent will directly increase demo signups, and that decision is what promotes a plain metric into a KPI. Strip away the business goal and the target, and it falls right back down to being just a metric again.
KPIs are also few in number by design. A functioning marketing dashboard should have somewhere between three and seven KPIs, not thirty. The moment a report lists more KPIs than a team can realistically act on in a week, most of those are metrics wearing a KPI badge.
Another thing worth knowing early: KPIs sit at different levels depending on who is looking at them. A CMO cares about a company-wide KPI like customer acquisition cost across the entire marketing budget. A performance marketing manager one level down cares about a channel-specific KPI like cost per lead on Google Ads specifically. Both are legitimate KPIs, just scoped to different responsibilities. Confusing the level a KPI belongs to is another quiet way reports go sideways, because a channel manager reporting on company-wide CAC has no real ability to move that number alone, and gets judged unfairly against it.
The One-Line Way to Tell Them Apart
Here is the fastest test: ask “does this number have a target, a timeframe, and an owner attached to it?” If yes, it is a KPI. If the answer is “it is just a number we track,” it is a metric, and that is completely fine, metrics still matter for diagnosis and context. The mistake only happens when a metric gets treated as if it were a KPI without ever going through that filtering step.
Look at what actually happens in most reporting meetings. Someone pulls up Google Analytics, screenshots whatever chart is trending upward, and drops it into a slide labeled “Key Results.” That chart might be sessions, which is a metric, presented as if it answers the business question, which only a KPI can do. That habit is exactly what this next section digs into.
Try applying the test to two random numbers right now. “Instagram Reels views this month” has no target, no timeframe attached beyond the reporting period itself, and usually no clear owner beyond “whoever posts content.” That is a metric. “Reduce cost per lead on Google Ads from 850 rupees to 600 rupees by December, owned by the performance marketing lead” has all three elements sitting right there in the sentence. That is a KPI. Running every number through this exact test before it goes into a report takes about ten seconds and saves an enormous amount of confusion later.
Digital Marketing Metrics vs KPIs: Why Marketers Mix Them Up
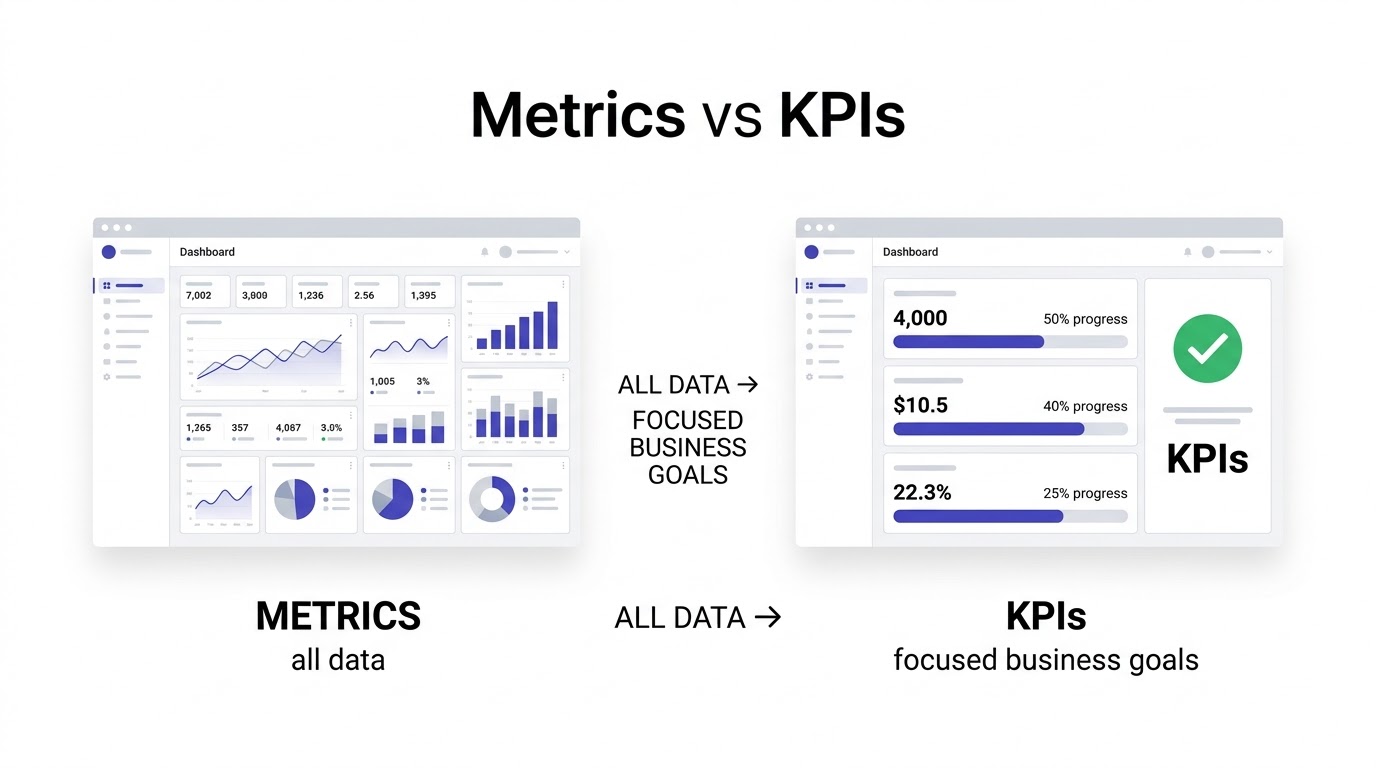
The confusion between digital marketing metrics vs KPIs is not accidental. It gets baked into how platforms are built, how agencies present results, and how teams get evaluated internally. Understanding why the mix-up happens is the first step to fixing it for good.
Vanity Metrics That Get Mistaken for KPIs
A vanity metric looks impressive on a slide but has no clear connection to revenue, leads, or business growth. Follower count is the classic example. A brand can hit 50,000 Instagram followers and still generate zero qualified leads if those followers were bought through a giveaway or a follow-for-follow campaign. The number goes up, the business does not move an inch.
Impressions and reach fall into the same category more often than people admit. A display ad campaign can rack up two million impressions for a modest budget, and the client reads that as success because the number is huge. Nobody asks how many of those impressions led to a click, and how many clicks led to anything resembling a sale. Reach without a downstream connection to conversion is a metric enjoying a moment in the spotlight, not a KPI.
Page views behave the same way. A blog post that gets 20,000 page views feels like a win, and it might genuinely be one, but only if the traffic goal was ever defined as page views in the first place. If the actual business goal was newsletter signups from that blog post, and only 40 people out of 20,000 visitors signed up, the page view number is a distraction dressed up as a result.
There is a quieter version of this problem too, one that shows up specifically inside YouTube and video marketing reports: total watch time and view count. A video hitting 500,000 views sounds massive, but if average view duration is 8 seconds on a 3 minute video, that number is really just measuring how many people scrolled past a thumbnail before losing interest, not how many people actually absorbed the message. Watch time percentage and audience retention curve tell a far more honest story than raw view count ever will, and yet raw view count is almost always the number that ends up on the slide because it is the bigger, shinier figure.
Why Dashboards Make the Confusion Worse
Most analytics dashboards are built to show everything, not the right thing. Google Analytics 4, Meta Business Suite, and LinkedIn Campaign Manager all default to displaying dozens of metrics side by side with equal visual weight. Nothing on the default view tells a team which number actually connects to revenue and which one is just noise. Every chart looks equally important because the software has no idea what the business goal is.
This is where most teams go wrong early. They open the dashboard, see a metric climbing, and report it without asking whether that climb means anything for the goal they were hired to hit. A custom dashboard built around three to five chosen KPIs solves this, but building one takes a deliberate decision that most teams skip because the default view already looks like a report.
Reporting templates make it worse too. A lot of agencies use the same monthly report template across every single client, which means the same fifteen metrics get pasted in regardless of whether the client cares about lead generation, ecommerce revenue, or app installs. The template was built for convenience, not for the client’s actual goal, and that is a big part of why so many marketing reports get politely ignored by the people paying for them.
Tool defaults add another layer to this. Google Ads, for example, opens straight to a summary view that leads with clicks and impressions before cost per conversion ever enters the picture, and a busy account manager pulling a quick screenshot for a client update naturally grabs whatever loads first. Semrush and Ahrefs both default to showing overall domain visibility scores prominently, a number that combines thousands of keywords of wildly different commercial value into one composite figure that looks great trending upward but says very little about whether the business made more money this month than last.
The Business Impact of Confusing the Two
When metrics get reported as KPIs, budget decisions start getting made on the wrong basis. A campaign manager who reports engagement rate as the primary success measure might keep pouring budget into a channel that generates likes and comments but never converts into paying customers. Meanwhile, a quieter channel generating fewer likes but three times the actual sales gets deprioritized because its metrics look less exciting on a slide.
This confusion also damages trust between marketing teams and leadership. A founder or CMO who keeps hearing about impressive metrics quarter after quarter, without seeing revenue move, starts questioning whether marketing spend is working at all. That is often not because the work is bad. It is because the reporting never separated what happened from what actually mattered to the business.
There is a career cost to this too, one that rarely gets talked about openly. A marketer who consistently reports metrics as if they were KPIs eventually gets caught out the moment a business owner starts asking sharper questions, and that moment usually lands badly, in the middle of a budget renewal conversation or a performance review. Marketers who instead walk into every meeting with a small, defensible set of KPIs tied directly to revenue or leads tend to keep budgets, keep contracts, and get trusted with bigger decisions faster, simply because their numbers hold up under scrutiny. This distinction is not just an academic exercise, it directly affects how seriously a marketer gets taken in a room full of decision makers.
Here is the thing though, fixing this is not about tracking fewer numbers. It is about being deliberate regarding which few numbers get promoted to KPI status, and that deliberate process is exactly what the next section walks through step by step.
How to Turn Digital Marketing Metrics Into KPIs: A Step-by-Step Framework
Knowing the difference between digital marketing metrics vs KPIs is only useful once it turns into a repeatable process. Here is the framework that actually works when applied to a new campaign, a new client, or a new quarter of planning.
Step 1: Start With the Business Goal, Not the Data
Every KPI selection process has to begin outside the analytics dashboard. Before opening Google Analytics or Meta Ads Manager, the first question is: what does the business need to happen in the next 30, 60, or 90 days? More qualified sales leads? Higher repeat purchase rate on an ecommerce store? Lower cost to acquire a new subscriber? That business goal, stated in plain language, is the anchor for everything that follows.
The mistake most beginners make is reversing this order. They open the dashboard first, notice which numbers are trending up, and then reverse-engineer a business justification for tracking them. That is backwards. A goal like “increase demo bookings by 25 percent this quarter” should exist as a sentence written down before a single metric gets chosen, because the goal decides which metrics matter, not the other way around.
Step 2: Pick the Metrics That Actually Move That Goal
With the business goal defined, the next step is mapping which metrics sit closest to that outcome. If the goal is demo bookings, the metrics that matter are things like landing page conversion rate, cost per lead from paid campaigns, and email click-through rate on nurture sequences that push toward booking a demo. Metrics like total website traffic or social media reach sit too far upstream to be trusted as the primary indicator, even though they might still be worth tracking for context.
A useful trick here is drawing the customer journey on paper and marking where each candidate metric sits along that path. Metrics closer to the actual business outcome, like conversion rate or cost per acquisition, deserve more weight than metrics sitting at the very top of the funnel, like impressions or reach. This is also where secondary metrics earn their place. They are not KPIs themselves but help explain why a KPI moved the way it did.
Picture a funnel with four stages: awareness, interest, consideration, and conversion. Impressions and reach live at the awareness stage, click-through rate and time on site live at interest, email signups and demo requests live at consideration, and closed deals or completed purchases live at conversion. The metric closest to conversion is almost always the strongest KPI candidate, because it has the fewest steps of interpretation between the number and actual revenue. A metric sitting way up at awareness needs several assumptions to hold true before it connects to money, and every one of those assumptions is a place the connection can quietly break down without anyone noticing for months.
Step 3: Set a Target, a Timeframe, and an Owner
A metric only becomes a real KPI once three things get attached to it: a specific target number, a deadline, and a named person or team accountable for hitting it. “Improve conversion rate” is not a KPI. “Increase landing page conversion rate from 2.1 percent to 3.5 percent by the end of Q3, owned by the paid media team” is a KPI. The difference is precision.
Targets should come from a mix of historical performance and industry benchmarks, not a random round number picked because it sounds ambitious. If a landing page has converted at 2 percent for the last six months, jumping the target to 10 percent in one month is not a stretch goal, it is a setup for a demoralizing report. A realistic stretch, based on what similar pages or competitors typically achieve, keeps the KPI credible and keeps the team actually trying to hit it instead of writing it off early.
Ownership matters just as much as the number itself, and this is the part teams skip most often. A KPI without a named owner tends to become everyone’s responsibility on paper and nobody’s responsibility in practice. When cost per lead is assigned specifically to the paid media manager, and organic conversion rate is assigned specifically to the SEO lead, accountability during a review meeting becomes a straightforward conversation instead of a vague group discussion where nobody quite knows who is supposed to fix what. This single change, naming an owner next to every KPI, tends to improve reporting discipline faster than almost any dashboard redesign.
Step 4: Build a Reporting Cadence Around the KPI, Not the Metric
Once KPIs are locked in, the reporting rhythm should revolve around them specifically, checked weekly or biweekly depending on how fast the channel moves. Paid campaigns often need weekly KPI check-ins because spend and performance shift quickly. SEO KPIs move slower, so a monthly cadence usually makes more sense there. The mistake to avoid is building one universal reporting schedule for every channel regardless of how fast that channel actually changes.
Every reporting cadence should also include a short note on what caused the movement, up or down, in each KPI. A KPI dashboard that just shows numbers changing over time without context turns back into a plain metrics report. The commentary connecting the number to a decision made, a creative change, or a market shift is what keeps the KPI conversation useful instead of just decorative.
Tools make this cadence easier to maintain than it used to be. Looker Studio, formerly Google Data Studio, lets teams pull live data from Google Analytics, Google Ads, and Meta Ads into a single dashboard filtered down to just the chosen KPIs, refreshed automatically instead of manually rebuilt every reporting cycle. Setting this up once, with only the agreed KPIs pinned to the top of the dashboard and everything else tucked into a secondary tab, removes the daily temptation to report on whatever number happens to be climbing that week.
Getting comfortable with this exact process is one of the core skills taught inside a structured digital marketing course, because picking the right KPI is a repeated decision every marketer has to make on nearly every project, not a one-time setup task.
Digital Marketing Metrics vs KPIs Across Different Channels
The distinction between digital marketing metrics vs KPIs does not look the same across every channel. What counts as a KPI on a paid ads campaign would just be background noise on an SEO report, and vice versa. Breaking it down channel by channel makes the difference much easier to apply in real work.
SEO Metrics vs SEO KPIs
SEO throws off a huge volume of metrics: organic sessions, keyword rankings, click-through rate from search results, pages indexed, backlinks acquired, domain authority score. Every one of these gets tracked constantly inside tools like Google Search Console or Semrush, and every one of them is genuinely useful for diagnosis.
But the SEO KPI depends entirely on the business goal behind the SEO work. For a lead-generation business, the real KPI is usually organic leads or organic conversion rate, not keyword rankings. Ranking first for a keyword that nobody who buys the product actually searches for is a wasted win. For an ecommerce store, organic revenue and organic-assisted conversions matter far more than raw traffic volume. Keyword position, backlinks, and domain authority stay useful as supporting metrics that explain why the KPI moved, but they rarely deserve to be the headline number on a report to a business owner.
A common mistake in SEO reporting specifically is treating keyword rank as the KPI by default because it is the easiest thing to show movement on. Rankings can climb for months while organic traffic and organic leads stay completely flat, especially if the ranking keywords carry low commercial intent. That is exactly the kind of gap a solid SEO strategy is supposed to catch early.
A real example: an SEO team ranks a B2B software client at position 2 for a keyword getting 8,000 monthly searches. Traffic to that page jumps noticeably the next month, and the rankings screenshot makes it into every report after that. Six months later, that page has generated exactly 3 demo requests, because the keyword was informational, people searching it wanted a definition, not a product. Meanwhile a much smaller keyword, ranking at position 4 and pulling only 300 monthly searches, quietly generated 40 demo requests because it carried high buying intent. If organic leads had been the tracked KPI from day one instead of keyword position, that budget and content effort would have shifted toward the second keyword months earlier.
Paid Ads Metrics vs Paid Ads KPIs
Paid advertising platforms generate metrics faster than any other channel: impressions, clicks, click-through rate, cost per click, frequency, relevance score, video view rate. Meta Ads Manager and Google Ads both surface these numbers in real time, updated multiple times a day.
The KPI for paid ads is almost always tied to cost and outcome together, not clicks or impressions alone. Cost per acquisition, return on ad spend, and cost per qualified lead are the numbers that decide whether a campaign gets more budget or gets paused. Click-through rate is a useful diagnostic metric, since a low CTR often signals weak ad creative or poor targeting, but a high CTR with a low conversion rate still means the campaign is failing at its actual job.
A specific example: a Facebook campaign with a 4.5 percent CTR looks fantastic compared to the typical 0.9 percent industry average. If that same campaign has a cost per acquisition of 2,400 rupees against a product that sells for 800 rupees, the CTR win means nothing. The KPI, cost per acquisition against product margin, is the number that should be driving the budget decision, not the flattering CTR sitting next to it.
Return on ad spend deserves a closer look too, because it is one of the most misused numbers in paid media reporting. An account showing a 6x ROAS sounds like a clear win, but that ratio only accounts for ad spend against revenue, not the actual cost of goods, shipping, payment gateway fees, or returns. A product with thin margins can post a beautiful 6x ROAS and still lose money on every sale once the full cost stack gets factored in. That is why performance marketers who actually understand the difference between digital marketing metrics vs KPIs push for a break-even ROAS calculation specific to the product’s margin before setting any campaign target, rather than chasing a generic ROAS benchmark pulled from a blog post about a completely different industry.
Social Media Metrics vs Social Media KPIs
Social platforms are the biggest source of vanity metrics in the entire industry. Likes, comments, shares, followers, and reach all get displayed prominently on every platform’s native analytics, and all of them feel good to report because the numbers are usually large and visually satisfying.
Actual social media KPIs depend on why the brand is on social media in the first place. If the goal is community building for a SaaS product, engagement rate per post and share of voice against competitors are reasonable KPIs. If the goal is driving traffic to a product page, click-through rate to the website and conversion rate from that traffic are the real KPIs, and follower count barely matters in that context. A brand with 5,000 highly engaged followers who regularly click through and buy will outperform a brand with 50,000 passive followers every time it actually counts.
Running social media as an actual revenue channel, not just a brand presence, requires setting these KPIs before the content calendar gets built, not after the campaign is already running. That is the kind of planning covered inside social media strategy work, where content decisions get made backward from the KPI instead of forward from whatever trend is popular that week.
Reels and short-form video complicate this further because Instagram and YouTube both push creators toward chasing view count as the default success signal, since that is the number displayed most prominently right under the video. A reel that hits 200,000 views but sends only 30 people to the link in bio has done its job for reach, poorly for anything downstream. Save rate and share rate tend to be far better engagement indicators than raw views for brands trying to build an actual audience, because saving or sharing a post requires enough interest to take an action, while a view just requires the algorithm to place the content in front of someone for two seconds.
Influencer and UGC Metrics vs KPIs
Influencer marketing brings its own version of this confusion, and it deserves a quick separate mention. Brands frequently report reach and impressions from influencer campaigns as the headline result, largely because those are the numbers influencers themselves are most comfortable sharing. The actual KPI worth tracking is usually a unique promo code redemption rate or a trackable link’s conversion rate, tied back to that specific influencer, so budget for the next quarter goes toward the creators who genuinely drove sales rather than the ones with the biggest follower count on their profile.
Email Marketing Metrics vs Email Marketing KPIs
Email marketing tools like Mailchimp and Klaviyo report open rate, click rate, unsubscribe rate, bounce rate, and list growth rate by default on every campaign sent. These are all metrics worth watching, particularly for deliverability health, but very few of them are true KPIs on their own.
The real KPI for most email programs is revenue per email sent, or conversion rate from a specific automated flow like an abandoned cart sequence or a welcome series. Open rate is a decent proxy metric because a low open rate signals a subject line or deliverability problem, but a 40 percent open rate on a campaign that generates zero purchases is not a win by any real business definition. Klaviyo’s own benchmark data across ecommerce brands consistently shows that flows like abandoned cart emails generate significantly higher revenue per recipient than one-off broadcast campaigns, which is exactly the kind of insight that only shows up once revenue, not open rate, becomes the tracked KPI.
Unsubscribe rate and spam complaint rate also deserve attention as metrics, not KPIs, because they act as early warning signals rather than performance goals. A sudden jump in unsubscribes after a campaign usually points to a mismatch between what was promised in the subject line and what the email actually delivered, or simply too frequent a sending schedule. Watching that number helps protect deliverability, which in turn protects the actual KPI, revenue per email, because a sender reputation that tanks from complaints eventually lands every future campaign straight into the spam folder regardless of how good the offer is.
Building a list and nurturing it properly starts with understanding this distinction early, which is a core piece of email marketing fundamentals for anyone starting from scratch.
Mistakes When Setting Digital Marketing KPIs
Even after understanding digital marketing metrics vs KPIs conceptually, teams still trip over the same handful of mistakes when it comes to actually setting and using KPIs day to day. Here are the ones that show up most often, along with the fix for each.
Mistake 1: Too Many KPIs on One Dashboard
A dashboard with fifteen KPIs is not a KPI dashboard anymore, it is just a metrics report with a fancier name. When everything is labeled a priority, nothing actually gets prioritized, and teams end up spending review meetings scrolling through numbers instead of making decisions about any of them.
The fix is brutal simplicity. Pick three to five KPIs per goal, not per channel, and resist the urge to add “just one more” number because it happens to look good that month. If a channel genuinely needs more tracking depth, that extra detail belongs in a supporting metrics section underneath the KPI dashboard, not mixed in at the same level of importance.
A simple gut check works well here: print out the current dashboard and cross out every number that would not change a decision if it moved up or down 20 percent next week. Whatever survives that exercise is usually the real KPI list, and it is almost always shorter than the original dashboard, sometimes by more than half.
Mistake 2: Copying KPIs From a Blog Post Instead of the Business
A lot of teams grab a generic list of “top 10 digital marketing KPIs” from an article online and apply it directly to their own business without adjusting for what that specific business actually needs. A B2B SaaS company and a D2C skincare brand should never be tracking the exact same set of KPIs, because their sales cycles, customer journeys, and revenue models are completely different.
The fix is going back to Step 1 of the framework covered earlier: start from the business goal every single time, not from a template. A generic KPI list is a decent starting point for ideas, but it should never be copied wholesale into a live reporting dashboard without checking whether each one actually maps to that specific business’s current priorities.
A quick way to test whether a borrowed KPI actually fits is asking, “if this number hit its target next month, would the business owner notice the difference in revenue or growth?” A B2B lead gen company copying an ecommerce brand’s KPI of average order value would fail this test instantly, since B2B deals rarely close through a single online transaction with a variable order value in the first place. That mismatch would have been obvious from the start if the KPI had been built from the business model instead of copied from an unrelated case study.
Mistake 3: Never Revisiting KPIs After Setting Them
KPIs set at the start of a quarter can go stale fast, especially in fast-moving businesses where priorities shift after a funding round, a new product launch, or a change in leadership. A team that keeps reporting on the same KPI for a year without checking whether it still matches the current business goal ends up optimizing for something the business has already moved on from.
The fix is a scheduled KPI review, ideally every quarter, where the team explicitly asks whether each current KPI still connects to what the business needs right now. If a KPI has been consistently hit for three straight quarters with no real strategic conversation happening around it, that is usually a sign it has become too easy or too irrelevant to keep serving as a meaningful indicator, and it is time to raise the bar or swap it out entirely.
Getting this rhythm right, reviewing KPIs on a schedule instead of letting them run on autopilot, is one of the habits that separates teams who actually grow a business from teams who just produce reports every month. It is a small operational discipline, but it compounds over quarters in a way that shows up clearly in case studies of brands that scaled their marketing systematically instead of chasing whatever number looked good that week.
Mistake 4: Setting KPIs the Team Has No Control Over
This one is subtle and it trips up even experienced marketers. A content team gets handed a KPI of “increase overall company revenue by 15 percent,” when in reality revenue depends on sales team performance, pricing changes, seasonality, and product availability, none of which the content team has any direct influence over. When the KPI sits too far removed from what the team can actually control day to day, it stops functioning as a useful indicator and starts functioning as a source of frustration, because hitting or missing it often has nothing to do with the quality of the actual marketing work being done.
The fix is scoping every KPI to the level of control the responsible team genuinely has. A content team can reasonably own organic traffic growth, content-assisted leads, or time on page for cornerstone articles, all things directly shaped by the content they produce. Overall company revenue can still sit as a company-wide north star metric everyone keeps in mind, but it should not be the direct KPI assigned to a team whose actions only influence one small piece of that larger number. Scoping KPIs this way also makes performance reviews fairer, since a team only gets judged on outcomes they had a real chance of moving.
A practical example: an agency managing paid social for a furniture ecommerce brand originally had “increase total store revenue” as their headline KPI. Revenue also depended heavily on a warehouse stock issue that caused stockouts on the brand’s three best-selling products for six weeks. The paid social campaigns were performing well by every controllable measure, click-through rate up, cost per click down, but total revenue still dropped because the products people wanted to buy were simply unavailable. Once the KPI got rescoped to cost per acquisition and traffic to in-stock product pages specifically, the report finally reflected what the paid social work was actually doing, separate from a supply chain problem nobody on the marketing side could fix.
Conclusion
The real difference between digital marketing metrics vs KPIs comes down to intent and accountability. A metric measures what happened. A KPI ties a specific measurement to a business goal, a target, a timeframe, and a person responsible for moving it. Every KPI is built from a metric, but treating every metric like it deserves KPI status is exactly how reports end up full of numbers and empty of decisions.
The practical move going forward is simple: before the next campaign report gets built, write down the actual business goal first, then work backward to the handful of metrics that genuinely reflect progress toward it, attach a target and an owner to each, and let everything else sit in the supporting metrics section where it belongs. That one habit changes marketing reporting from a wall of numbers into a set of decisions leadership can actually act on.
Nobody gets this perfectly right on the first attempt, and that is fine. Even experienced marketers occasionally catch themselves defaulting to whatever number the dashboard puts front and center. The difference between a team that reports well and one that does not usually comes down to whether someone in the room is willing to ask “but what does this number actually change?” every single time a metric gets presented as a result. Building that habit into a team, more than any tool or template, is what makes digital marketing metrics vs KPIs stop being a confusing distinction and start being a working filter applied to every report from now on.
Frequently Asked Questions
What is the main difference between a metric and a KPI in digital marketing?
A metric is any measurable data point tracked across a campaign or channel, such as impressions or page views. A KPI is a metric that has been specifically chosen to reflect progress toward a defined business goal, with a target number, a timeframe, and an owner attached to it.
Are all KPIs metrics, but not all metrics are KPIs?
Yes, that relationship is exactly right. Every KPI starts out as a metric, but it only becomes a KPI once it gets tied to a business goal with a specific target and accountability behind it. The vast majority of metrics tracked on any platform never get promoted to KPI status, and that is normal.
How many KPIs should a digital marketing dashboard have?
Most functioning marketing dashboards work best with three to seven KPIs total, tied to the primary business goals for that period. Going beyond that number usually means some of those KPIs are actually supporting metrics that got mislabeled, which dilutes focus during reporting and planning.
What is an example of a vanity metric that gets mistaken for a KPI?
Follower count and social media reach are the most common examples. Both numbers can grow significantly without producing any measurable business outcome like leads, sales, or signups, which is exactly why they should rarely be treated as a primary KPI on their own.
How do you choose the right KPIs for a marketing campaign?
Start by clearly defining the business goal the campaign needs to support, then identify which metrics sit closest to that outcome in the customer journey. Attach a specific target, a deadline, and an owner to those chosen metrics, and that combination is what turns them into working KPIs.
Is conversion rate a metric or a KPI?
Conversion rate is a metric by default, but it becomes a KPI the moment a business sets a specific target for it, such as raising landing page conversion rate from 2 percent to 3.5 percent within a quarter, and assigns someone to be accountable for that outcome.
Why do marketing teams often confuse metrics with KPIs?
Analytics dashboards display dozens of metrics with equal visual weight by default, without indicating which ones connect to actual business outcomes. Combined with generic reporting templates used across multiple clients or projects, this makes it easy for teams to report whatever number is trending up instead of the number that actually matters.
Do KPIs change for different marketing channels like SEO, paid ads, and social media?
Yes, KPIs shift significantly by channel because each channel plays a different role in the customer journey. SEO KPIs often center on organic leads or organic revenue, paid ads KPIs usually revolve around cost per acquisition or return on ad spend, and social media KPIs depend heavily on whether the goal is brand awareness, engagement, or direct traffic conversion.
How often should digital marketing KPIs be reviewed?
Most businesses benefit from reviewing their KPIs at least once every quarter, though fast-moving channels like paid advertising often need weekly or biweekly check-ins on performance against the current target. A full strategic review of whether the KPIs themselves are still relevant should happen at minimum every quarter.
What happens if a business tracks too many KPIs at once?
Tracking too many KPIs spreads a team’s attention thin and makes it harder to prioritize which numbers actually deserve action during a review meeting. It also tends to signal that some of those “KPIs” are really just metrics that were never properly filtered down to what matters most for the current business goal.
Can a metric become a KPI later even if it isn’t one now?
Absolutely, and this happens often as business priorities shift. A metric like email list growth rate might sit as background data for months, then get promoted to a KPI once list building becomes a stated business priority tied to an upcoming product launch or seasonal campaign.
Is ROI considered a KPI or a metric in digital marketing?
Return on investment is almost always treated as a KPI rather than a plain metric, because it is inherently tied to a business outcome, cost, and return, and it typically comes with a target percentage that leadership expects the marketing spend to hit within a given period.
What is the difference between a leading and a lagging KPI?
A leading KPI predicts future performance and can be influenced in the short term, such as qualified leads generated this week. A lagging KPI reflects a result that has already happened and is harder to change quickly, such as quarterly revenue or customer lifetime value. Good dashboards usually include a mix of both, since leading KPIs help teams course-correct early, while lagging KPIs confirm whether those corrections actually worked.
Should small businesses track KPIs differently than large companies?
Small businesses generally benefit from tracking fewer, simpler KPIs directly tied to cash flow and customer acquisition, since they rarely have the resources to chase brand awareness metrics that take months to translate into revenue. Large companies with bigger budgets can afford to track brand-level KPIs alongside performance KPIs because they can sustain longer feedback loops before needing to see direct revenue impact.
Can a KPI be qualitative instead of a number?
Most KPIs are quantitative because they need a measurable target to track progress against, but some businesses do track qualitative indicators like customer satisfaction score or net promoter score, which are technically survey-based numbers rather than raw platform metrics. These still function as KPIs as long as they are tied to a specific target and reviewed on a set schedule, even though the underlying data comes from people’s opinions rather than platform analytics.