


A business spent close to 40 lakh rupees on Facebook and Google ads last quarter. Sales barely moved. Nobody could say which campaign brought in the four real customers who converted, or why the other three hundred people who clicked never came back. That is not a rare story. That is most small and mid-size businesses, every single quarter, running spend on gut feeling and calling it “strategy.”
Marketing without analytics is just guessing with a bigger budget. You put money into channels, content, and campaigns, and you hope something sticks. Marketing analytics is what turns that hope into a system you can actually manage, a way to see what worked, what flopped, and why, using real numbers instead of vibes. It is the difference between “our Instagram is doing okay” and “our Instagram drives 12% of qualified leads at a cost per lead that is 30% lower than Google Ads.”
This guide breaks down exactly what marketing analytics means, the types you need to know, the metrics worth tracking (and the ones that waste your time), the tools people actually use day to day, and a real step-by-step process to set this up even if numbers have never been your strong point. No fluff, no vague “leverage data-driven insights” talk. Just what marketing analytics is, and how to use it.
Honestly, most people avoid analytics for years because it looks like a spreadsheet problem, full of formulas and jargon nobody explained properly the first time. It is not. Once the core logic clicks, checking a dashboard becomes as routine as checking a bank balance. That is the goal of this guide: not to turn anyone into a data scientist, but to build the habit of asking “what does this number actually mean” every single time a report opens.
What You Will Learn in This Guide
- What marketing analytics actually means, and how it is different from web analytics or business intelligence
- The four types of marketing analytics and when each one is useful
- The metrics that genuinely matter versus vanity numbers that look good in a report and mean nothing
- The tools most marketers use for tracking, from free options to paid platforms
- A step-by-step process to build a working analytics setup from scratch
- The most common mistakes beginners make with data, and how to avoid them
- Whether marketing analytics is a viable career path, and what skills it demands
What Is Marketing Analytics?
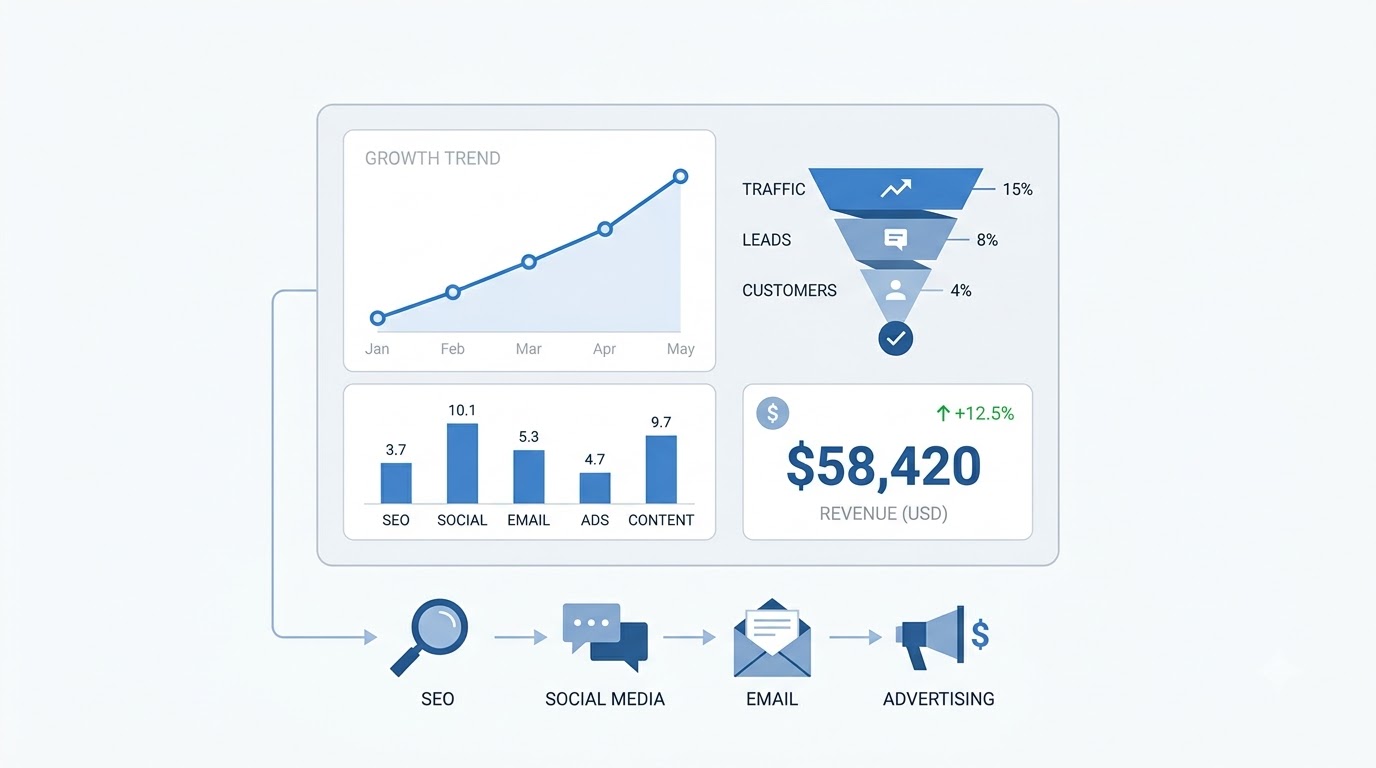
Marketing analytics is the practice of collecting, measuring, and analyzing data from your marketing efforts to understand what is working, what is not, and what to do next. It covers everything from how many people saw your ad, to how many clicked it, to how many of those clicks turned into paying customers, and how much it cost you to get each one.
The goal is simple even though the execution rarely is: connect marketing activity to business outcomes. Not “we posted 20 times this month,” but “those 20 posts drove 4,000 site visits, 180 email signups, and 12 sales worth 3.6 lakh rupees.” That second sentence is what marketing analytics produces. The first sentence is just activity tracking, and activity tracking without outcomes is how marketing teams lose budget every year.
Here is the thing most beginners get wrong early on: marketing analytics is not a tool. Google Analytics is a tool. HubSpot is a tool. Marketing analytics is the discipline of using those tools to answer specific business questions, like “which channel gives us the cheapest customers” or “why did conversion rate drop 15% after the last redesign.” The tool collects data. Analytics is what you do with it.
Marketing Analytics vs Web Analytics vs Business Intelligence
These three terms get mixed up constantly, and the confusion causes real problems when teams pick the wrong tool for the wrong job.
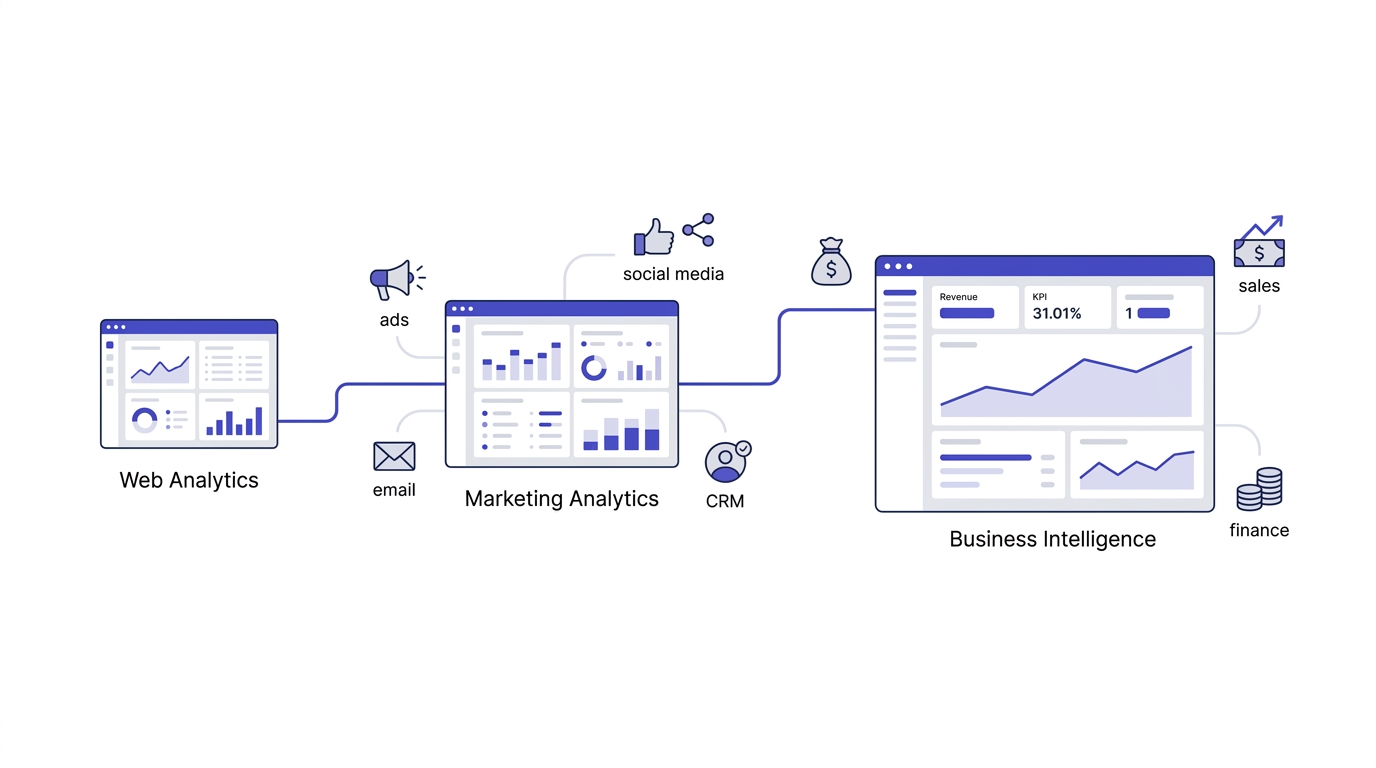
Web analytics is a subset of marketing analytics. It focuses specifically on what happens on your website or app, things like page views, bounce rate, session duration, and traffic sources. Google Analytics 4 is a web analytics tool. It tells you what happened on your site, but on its own it does not tell you whether that traffic turned into revenue unless you connect it to sales data.
Marketing analytics is broader. It pulls in web data, but also ad platform data (Meta Ads Manager, Google Ads), email data (open rates, click rates from Mailchimp or Klaviyo), social data (engagement, reach, follower growth), and CRM data (which leads became customers, and how long that took). Marketing analytics is the layer that connects all these sources so you can see the full customer journey, not just one slice of it.
Business intelligence (BI) sits one level above both. BI tools like Tableau or Power BI pull data from marketing, sales, finance, and operations into unified dashboards for company-wide decision making. A marketing analytics report might tell you Instagram Reels drive the cheapest leads. A BI dashboard tells the CEO how that fits into overall revenue, cash flow, and hiring plans. Marketing analytics feeds into BI, it is not a replacement for it.
Marketing Analytics vs Marketing Reporting
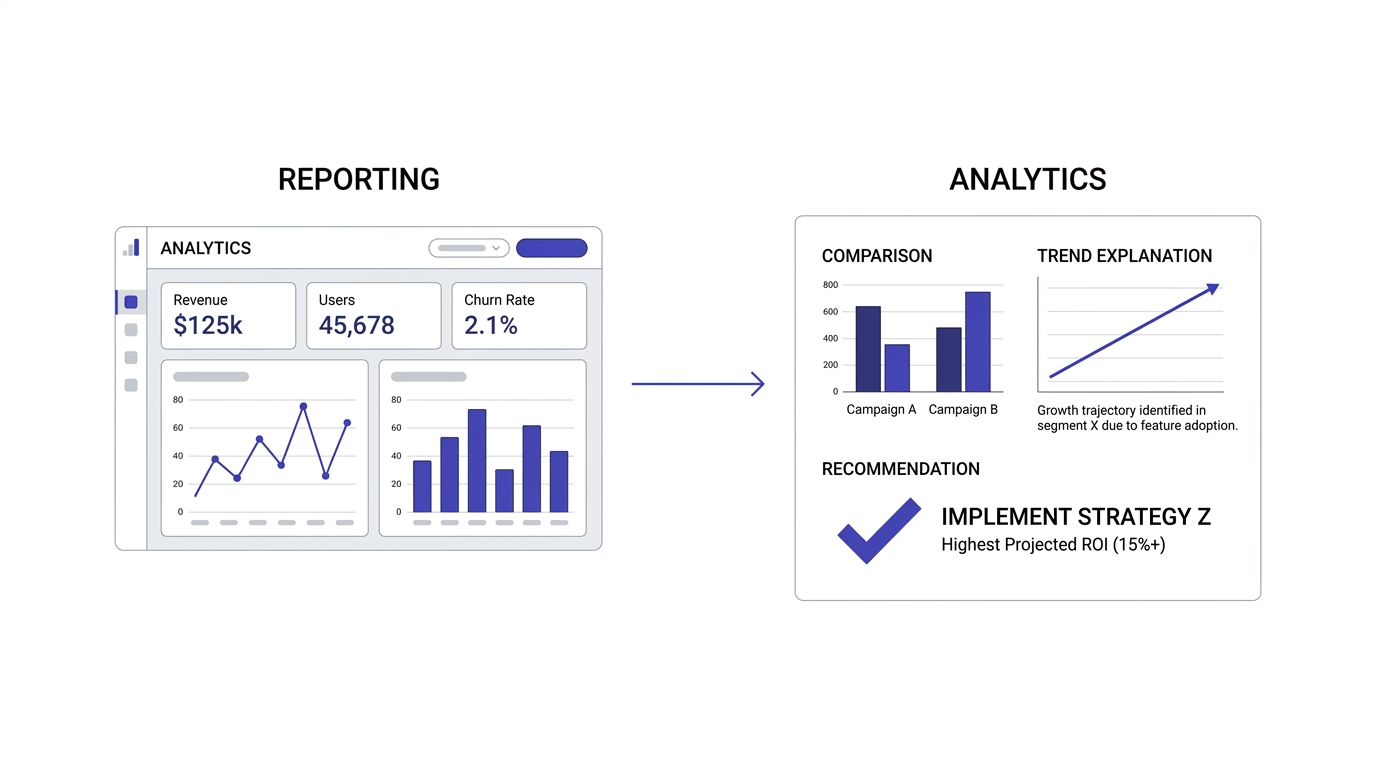
This is a smaller distinction, but it trips up a lot of beginners who assume the two words mean the same thing. Marketing reporting is the act of collecting numbers and presenting them, a weekly slide with traffic, followers, and email opens laid out neatly. It answers “what are the numbers this week.”
Marketing analytics goes further. It interprets those numbers, compares them against past periods and goals, and produces a recommendation. A report says “traffic was 12,400 visitors this week.” Analytics says “traffic was 12,400 visitors this week, down 18% from last week, driven almost entirely by a drop in organic search after a Google algorithm update on the 14th, and here is the page that lost the most ranking positions.” Reporting is the raw material. Analytics is what turns that material into a decision. Teams that only report, without analyzing, end up sending the same dashboard every week with nobody actually reading past the top line, because nothing in it tells anyone what to do.
Why Marketing Analytics Matters for Beginners to Learn Now
Every serious marketing role today expects some comfort with data. Not a data science degree, but the ability to open a dashboard, read it correctly, and make a decision from it. Job listings for content marketers, social media managers, and even copywriters increasingly mention “analytics-driven” or “comfortable with reporting tools” as a requirement, not a nice-to-have.
There is also a budget reality nobody talks about enough. Companies are cutting marketing spend that cannot prove itself. A campaign manager who can say “cut the Google Display budget, it is producing clicks at 8 rupees each but zero conversions in 90 days, and shift that 50,000 rupees to the email flow that is converting at 6%” keeps their budget and their credibility. One who cannot say that loses both. Learning marketing analytics early is less about following a trend and more about staying employable and useful in a field that has gotten measurable whether people like it or not.
The Different Types of Marketing Analytics You Should Understand
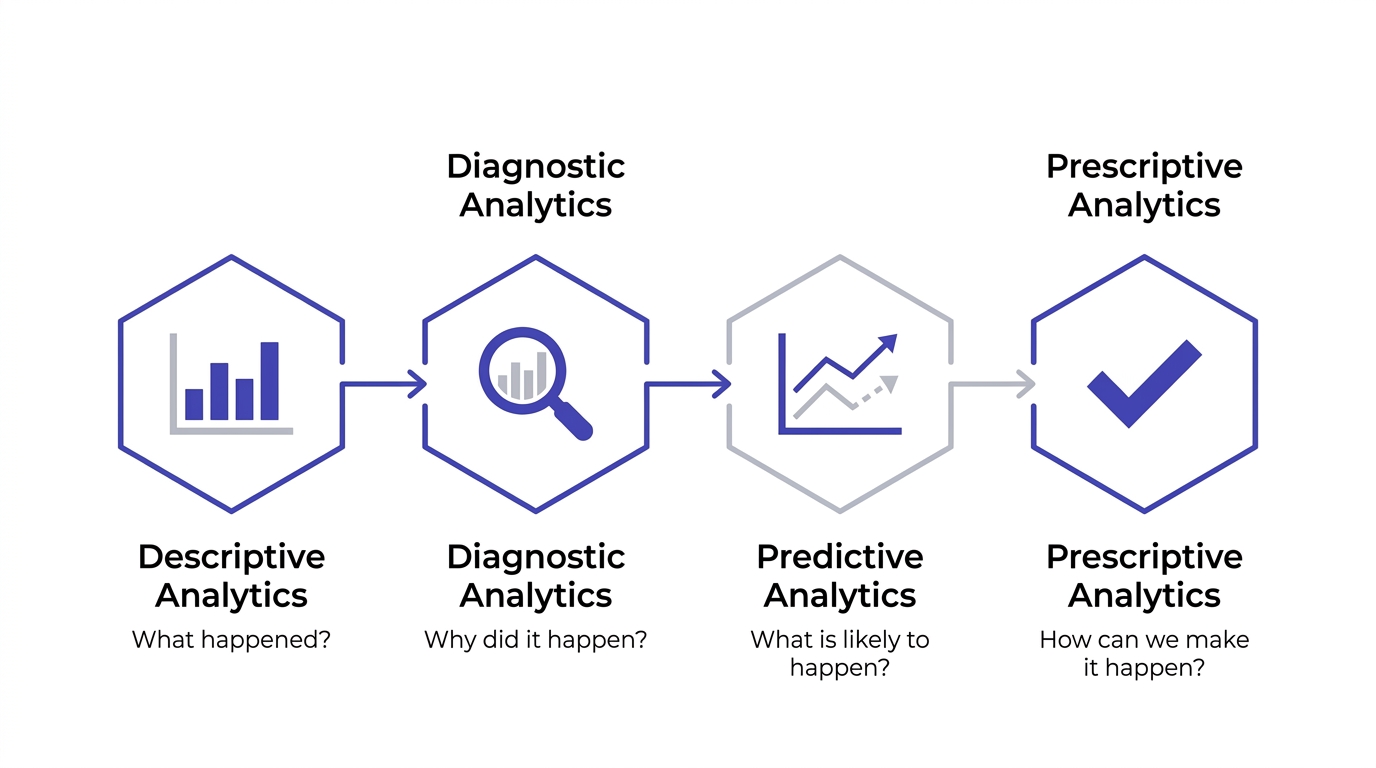
Not all analytics answer the same question. There are four distinct types, and mixing them up leads to reports that look impressive but do not actually help anyone decide what to do next. Understanding which type you are working with, and when to use which, is a foundational skill.
Descriptive Analytics: What Happened
This is the most common type, and usually the first one beginners learn. Descriptive analytics summarizes past data to answer “what happened.” Website traffic last month, email open rates for a campaign, total ad spend for the quarter, these are all descriptive numbers.
Descriptive analytics is where most dashboards live. Google Analytics 4’s default reports, a Facebook Ads Manager summary, a monthly social media report, all of it is descriptive. It is useful because you cannot improve what you have not measured, but it has a real limitation: it tells you what happened without telling you why. “Traffic dropped 20% last week” is descriptive. It raises a question. It does not answer one.
Think of descriptive analytics as the baseline everyone needs before doing anything smarter. A small ecommerce store checking last month’s total revenue, number of orders, and average order value against the month before is running descriptive analytics. It is not glamorous, but skipping it means jumping straight into “why” without a clear “what” to anchor the question, which usually leads to chasing the wrong problem entirely.
Diagnostic Analytics: Why It Happened
Diagnostic analytics digs into the “why” behind the descriptive numbers. If traffic dropped 20%, diagnostic analytics is the process of checking Google Search Console for ranking drops, checking if a major referral site stopped linking, checking if a competitor launched a big campaign, or checking if a technical issue broke tracking on part of the site.
This is where most beginners stall out, because diagnostic work requires cross-referencing multiple data sources instead of staring at one chart. Say email click-through rate dropped from 4% to 1.8% in a single send. Descriptive analytics tells you the number dropped. Diagnostic analytics means checking the subject line against past sends, checking send time, checking if the list had a recent unsubscribe wave, and checking spam placement using a tool like Mail Tester. Nine times out of ten, the answer is buried in a detail nobody checked first.
The discipline here is refusing to accept the first plausible explanation. It is tempting to blame “the algorithm” or “the market” the moment a number dips, because that requires no further digging. A properly trained diagnostic instinct checks the boring, technical explanations first, broken tracking, a changed audience segment, a send time collision with a public holiday, before reaching for the vague, unfalsifiable ones. Most drops have a specific, findable cause, not a mysterious one.
Predictive Analytics: What Is Likely to Happen
Predictive analytics uses historical data and statistical models to forecast future outcomes. This sounds advanced, and at the enterprise level it genuinely is, involving machine learning models built by data science teams. But at a beginner and small-business level, predictive analytics is far more approachable than people assume.
If your email list has converted at 2.3% for the last six campaigns with very little variance, predicting the next campaign will convert somewhere between 2% and 2.6% is basic predictive analytics, done with a spreadsheet and some common sense. Tools like Google Analytics 4’s built-in predictive metrics (purchase probability, churn probability) bring this capability to smaller teams without needing a data scientist on staff. The value is in planning: if you can predict a campaign will generate roughly 40 leads at your current conversion rate, you can plan sales capacity, inventory, or ad budget around that number instead of finding out too late.
The mistake to avoid here is treating a prediction as a guarantee. A forecast built on six months of stable data can fall apart the moment something external shifts, a competitor drops prices, a platform changes its algorithm, or a season changes buying behavior entirely. Predictive analytics is a planning tool, not a promise, and the businesses that get burned by it are usually the ones that stopped checking actual results against the forecast once the forecast felt convincing enough.
Prescriptive Analytics: What You Should Do Next
Prescriptive analytics is the most advanced layer. It takes the “what happened” and “why” and “what is likely to happen” and turns it into a specific recommendation. Where diagnostic analytics says “conversion rate dropped because checkout load time increased to 6 seconds,” prescriptive analytics says “reduce checkout load time to under 2 seconds by compressing images and removing the third-party chat widget script, which based on similar past fixes should recover roughly 1.2% of the lost conversion rate.”
Most small teams will not run formal prescriptive models. But the mindset matters more than the technology. Every analytics report should end with a recommendation, not just a chart. If a report shows numbers with no “so here is what we do next” attached, it is descriptive at best, and descriptive reports without action attached are the number one reason marketing analytics gets ignored by leadership. A structured foundation in digital marketing is usually where people first learn to connect the reporting layer to the decision layer, instead of treating them as separate skills.
A simple way to force this habit: end every internal report with one line that starts with “Recommendation:” followed by a specific, testable action and a timeframe. Not “we should improve checkout,” but “Recommendation: compress hero images on the checkout page by next Friday to bring load time under 3 seconds.” Vague recommendations get nodded at in meetings and then forgotten. Specific ones get assigned to someone and actually happen.
The Marketing Analytics Metrics That Actually Matter
There are hundreds of metrics you could track. Most of them do not matter for most businesses. Knowing the difference between a metric that drives decisions and one that just looks good in a slide deck is arguably the single most valuable analytics skill there is.
Traffic and Engagement Metrics
These describe how many people interact with your content and how they behave once they arrive. Sessions and users tell you volume. Bounce rate (the percentage of visitors who leave after viewing just one page) tells you whether your landing pages match what people expected when they clicked. Average engagement time (GA4’s replacement for the older “time on page”) tells you whether content actually holds attention.
The mistake beginners make here is chasing traffic as the end goal. Ten thousand visitors who bounce in eight seconds are worth less than eight hundred visitors who stick around and convert. Traffic is a leading indicator, not a result. Treat it as fuel for the funnel, not the finish line, and always look at where that traffic came from before celebrating a spike, because a viral post that brings in the wrong audience inflates the traffic number while doing nothing for revenue.
Segment traffic by source before drawing any conclusion from bounce rate too. A high bounce rate on a blog post is often completely normal, someone searched a question, got the answer in the first paragraph, and left satisfied. That same bounce rate on a product page is a real problem. Reading bounce rate the same way across every page type is one of the quickest ways to misdiagnose a healthy site as a broken one.
Conversion Metrics
Conversion rate is the percentage of visitors who complete a desired action, a purchase, a signup, a form fill, whatever counts as success for that specific page or campaign. This is usually the single most important number in any marketing report because it connects activity directly to outcome.
Cost per conversion (sometimes called cost per acquisition or CPA) tells you what each result actually costs. A campaign that gets 500 conversions sounds great until you realize it cost 45 lakh rupees to get them, at 9,000 rupees per conversion, on a product that sells for 4,000. That math kills businesses quietly because the “500 conversions” headline number feels like a win. Always pair conversion volume with conversion cost. One without the other tells half the story and the wrong half, usually the one that makes a bad campaign look successful.
Also worth tracking separately: micro-conversions versus macro-conversions. A macro-conversion is the final goal, a purchase or a signed contract. A micro-conversion is a smaller step along the way, adding to cart, starting a free trial, downloading a guide. Watching only macro-conversions on a long sales cycle (common in B2B) can make a campaign look dead for weeks when it is actually working, just further up the funnel than the final number shows.
Customer Value Metrics: CAC, LTV, and Churn
Customer Acquisition Cost (CAC) is the total cost of acquiring one paying customer, calculated by dividing total marketing and sales spend by the number of new customers in that period. Customer Lifetime Value (LTV or LTV) is the total revenue you can expect from a customer over the entire time they stay with you.
The relationship between these two numbers decides whether a business is actually sustainable. A healthy ratio is generally considered to be LTV at least three times CAC. If it costs 2,000 rupees to acquire a customer and that customer only ever spends 2,500 rupees total, the business is barely breaking even before accounting for product costs, salaries, and overhead. This is exactly why a startup can show impressive user growth on paper and still run out of cash, the growth was bought at a price the business model cannot sustain.
Churn rate, the percentage of customers who stop buying or cancel over a given period, connects directly to LTV. High churn quietly murders LTV even when acquisition looks strong. A subscription business acquiring 200 new customers a month while losing 180 existing ones is not actually growing, it is running in place while spending money to stand still.
Calculating these numbers does not require complicated software. LTV, at its simplest, is average order value multiplied by average purchase frequency multiplied by average customer lifespan in months or years. CAC is total marketing and sales spend for a period divided by new customers gained in that same period. Building this into a basic spreadsheet, updated monthly, gives most small businesses more clarity on their actual financial health than most of the vanity metrics floating around a typical social media report.
ROI and Attribution Metrics
Return on Investment (ROI) measures profit generated relative to spend, usually shown as a percentage or ratio. Return on Ad Spend (ROAS) is the ecommerce-specific cousin, calculated as revenue divided by ad spend. A ROAS of 4 means every rupee spent on ads generated four rupees in revenue, which sounds strong until you factor in product cost, shipping, and margin, because revenue is not profit.
Attribution is where things get genuinely complicated, and it is worth understanding even as a beginner because it changes which channel gets credit for a sale. Last-click attribution gives 100% credit to the final touchpoint before conversion. First-click gives all credit to the first touchpoint that brought the customer in. Multi-touch and data-driven attribution (the default model in Google Analytics 4) spread credit across every touchpoint in the journey based on actual influence.
Here is why this matters in practice: last-click attribution almost always overvalues search and retargeting ads, because those tend to be the final step before a purchase, while undervaluing awareness channels like social content and display, which start the journey but rarely close it. A business that judges every channel by last-click alone will keep cutting the channels that build demand in the first place, then wonder why sales eventually dry up.
A practical way to check this without overhauling the whole reporting system: pull the same 30-day period under both last-click and data-driven attribution inside GA4’s Advertising snapshot and compare how much credit shifts between channels. If organic social or display suddenly looks far more valuable under data-driven attribution, that is a strong sign the current budget allocation, likely built on last-click assumptions, is underfunding the channels actually doing the early, harder work of building demand.
The Best Marketing Analytics Tools for Beginners
Tools change, but the categories they fall into stay pretty stable. You need something to track website behavior, something to track search performance, something for social, something for email, and eventually something to pull it all together.
Google Analytics 4 (GA4)
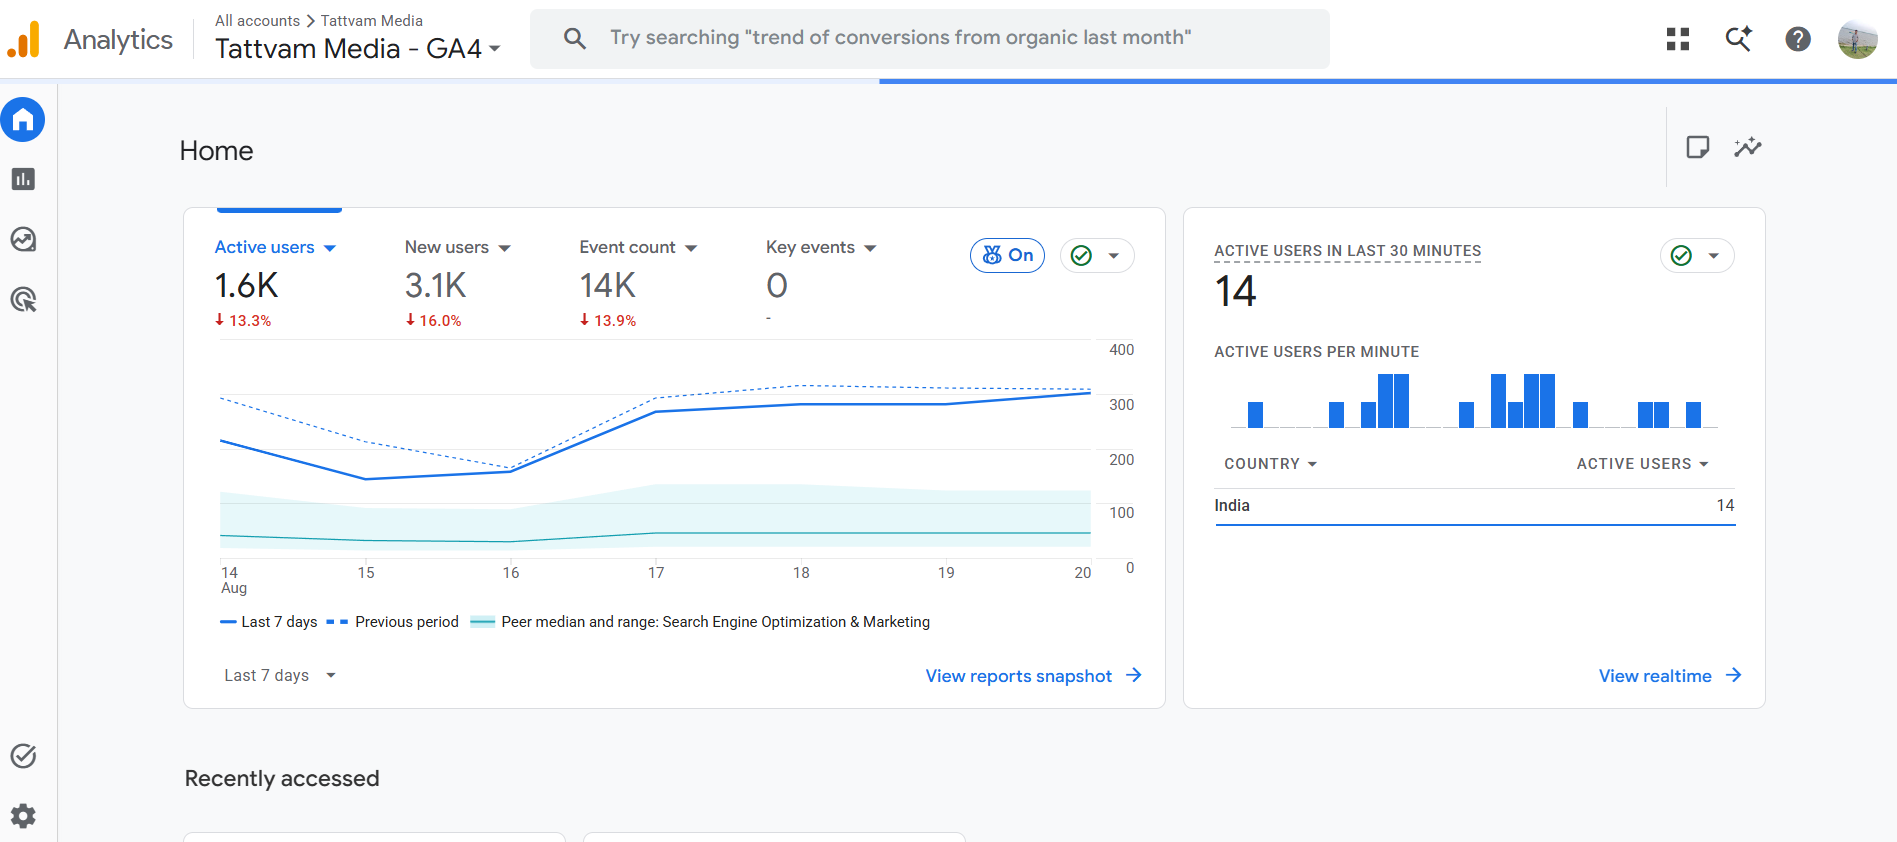
GA4 is the free, industry-standard tool for tracking website and app behavior. It replaced the older Universal Analytics in 2023 and works on an event-based data model instead of the old session-based one, meaning every action (a click, a scroll, a video play, a purchase) is logged as an individual event rather than being bundled into a generic pageview.
For a beginner, the two reports worth learning first are the Acquisition report, which shows exactly which channels (organic search, paid ads, social, referral, direct) are sending traffic, and the Engagement report, which shows what people actually do once they arrive. GA4 also includes Explorations, a free-form report builder that lets you build custom funnels to see exactly where people drop off between, say, adding a product to cart and completing checkout.
The learning curve on GA4 is real, and it catches a lot of people who used the older Universal Analytics interface off guard. The event-based model means there is no single “conversions” number sitting in one obvious place, you configure specific events as Key Events yourself. Spend the first week just clicking through the standard reports and comparing them against what you already know happened on the site that week. That single exercise builds more intuition than reading any documentation.
Google Search Console (GSC)
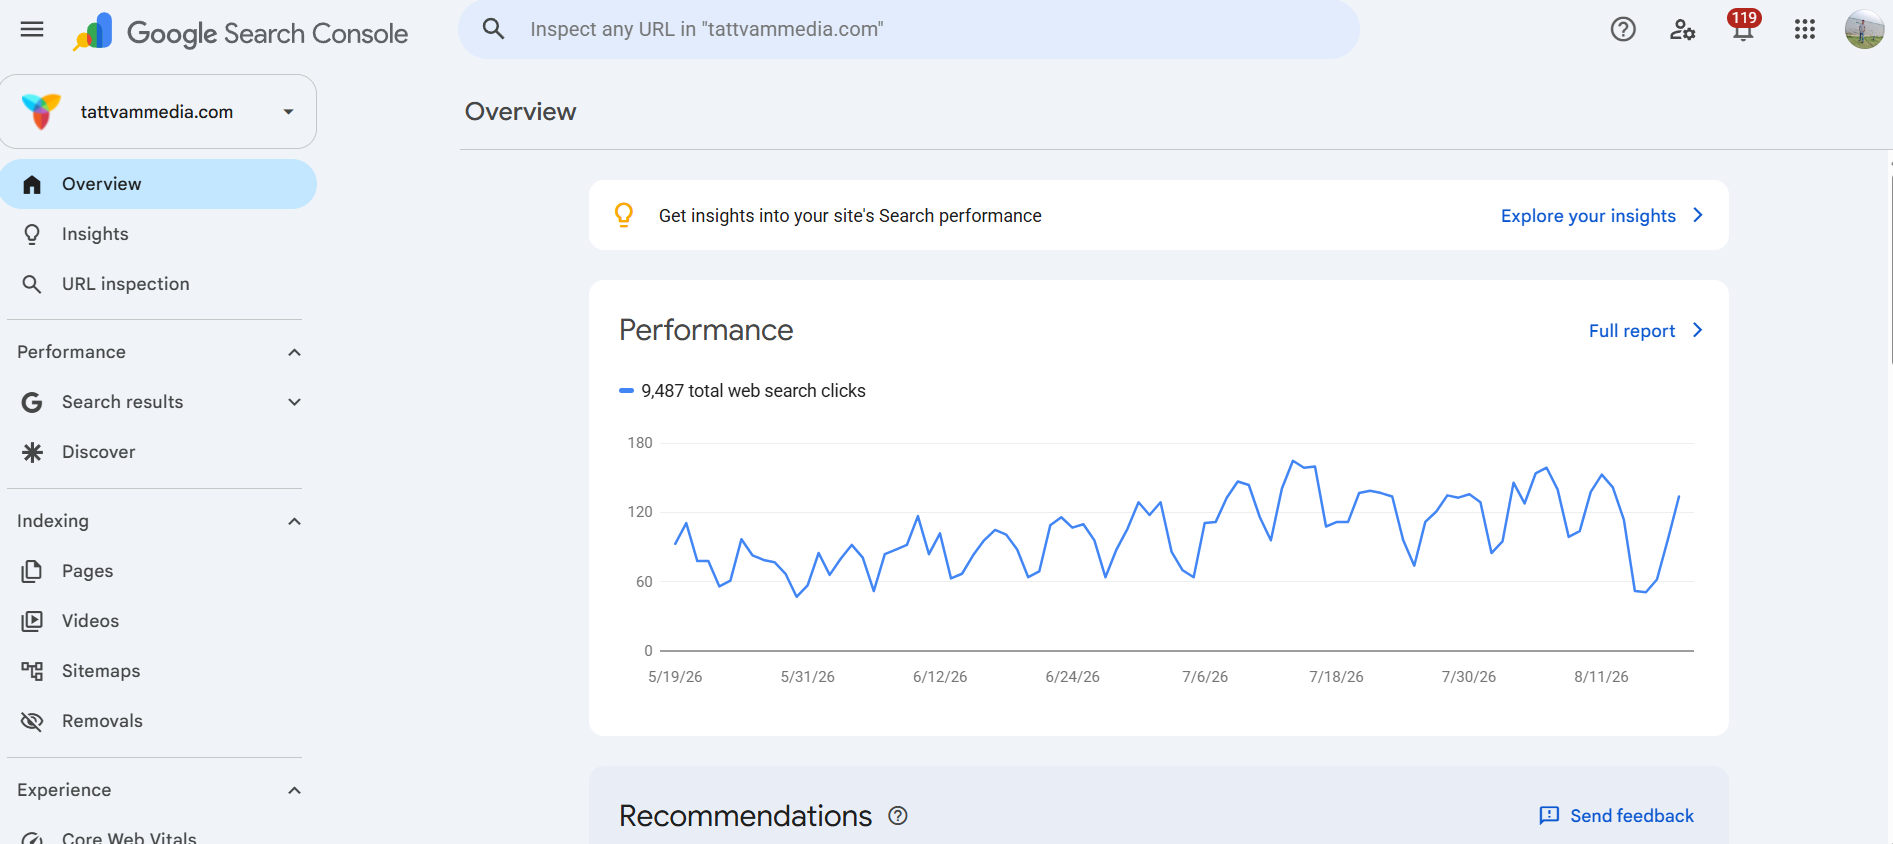
If GA4 shows what happens after someone lands on your site, Search Console shows what happens before that, specifically how your pages perform in Google Search. It shows the exact queries people typed before clicking your result, your average position for each query, click-through rate, and total impressions.
The most underused feature here is the Performance report filtered by query. Beginners often skip straight to “top pages” and miss that checking which specific search terms bring clicks (versus which just generate impressions with no clicks) reveals exactly which page titles and meta descriptions are failing to earn the click even when they rank well. Anyone getting into SEO and search performance tracking will spend a lot of time inside this specific report, because it is often the fastest way to find quick wins without writing a single new piece of content.
Search Console also flags technical problems GA4 will never show, indexing errors, mobile usability issues, and manual penalties. A page can drive zero traffic not because the content is bad, but because Google has not indexed it at all, and the Coverage report is the only place that surfaces that distinction clearly. Checking it monthly, even for a small five-page website, catches problems long before they show up as a mysterious traffic decline elsewhere.
Social Media Analytics Tools
Every major platform has native analytics built in: Instagram and Facebook have Meta Business Suite, X (formerly Twitter) has its Analytics dashboard, LinkedIn has Page Analytics, and YouTube has YouTube Studio. Each shows reach, engagement, follower growth, and top-performing content within that one platform.
The limitation is that native tools only show you that one platform in isolation. For anyone managing multiple channels, third-party tools like Sprout Social, Hootsuite, or Buffer Analyze consolidate everything into a single dashboard so you are not logging into five different apps every Monday morning to build one report. Beginners often skip this step and manually copy numbers into a spreadsheet, which works fine at a small scale but becomes unmanageable past two or three active platforms.
One number worth watching closely across every platform is engagement rate relative to reach, not follower count. A page can have flat or even slightly declining followers while engagement rate climbs, which usually signals the content is resonating more with the audience that actually sees it, even if the raw audience size is not growing fast. Followers are a vanity number on their own; engagement relative to reach is the number that tells you the content strategy is working.
Email Marketing Analytics
Platforms like Mailchimp, Klaviyo, and Brevo track open rate, click rate, unsubscribe rate, and, critically, revenue per email for ecommerce sends. Open rate has gotten less reliable since Apple Mail’s privacy update in 2021 started pre-loading images and inflating open counts artificially, so click rate and conversion rate matter more now than they used to.
Klaviyo specifically stands out for ecommerce because it ties email and SMS activity directly to Shopify or WooCommerce revenue data, so you can see that a specific abandoned cart flow generated 3.2 lakh rupees last month, not just that it had a 22% open rate. That direct revenue link is what separates useful email analytics from vanity metrics.
List health matters as much as any single campaign’s numbers. A list that has not been cleaned in a year, full of addresses that never open anything, drags down open rate, hurts sender reputation with inbox providers, and increases the risk of landing in spam for everyone, including engaged subscribers. Running a suppression pass every few months, removing anyone who has not opened in 90 to 120 days, usually improves overall deliverability enough that the remaining, smaller list performs noticeably better than the larger, unfiltered one did.
All-in-One Dashboards and Reporting Tools
Once you are pulling data from four or five sources, manually building reports every week stops being realistic. Looker Studio (formerly Google Data Studio) is a free tool that connects directly to GA4, Google Ads, Search Console, and dozens of other sources to build live, shareable dashboards. HubSpot offers a paid all-in-one option that bundles CRM, email, and web analytics for teams that want everything under one login. For deeper competitive and SEO-specific data, Semrush and Ahrefs both include analytics modules alongside their core keyword tools. Browsing a curated list of marketing tools before committing to a paid subscription is worth doing, since most of these platforms offer free trials and the right choice depends heavily on which channels you actually run.
How to Build a Marketing Analytics Process From Scratch
Having access to tools means nothing without a process. This is the part most guides skip entirely, jumping straight from “here are the tools” to “good luck.” Here is the actual sequence.
Step 1: Set Clear Goals and KPIs Before Touching Any Tool
Before opening a single dashboard, define what success actually looks like for the business. Is the goal more leads, more revenue, lower cost per acquisition, or better retention? Each goal points to a different set of Key Performance Indicators (KPIs) to track.
A business focused on lead generation should prioritize cost per lead and lead-to-customer conversion rate. An ecommerce store should prioritize ROAS and average order value. Skipping this step is the number one reason analytics setups fail: teams track everything available in GA4 by default, generate a 40-tab spreadsheet nobody reads, and abandon the whole system within two months because it produced noise instead of clarity.
A useful test when picking KPIs: for each metric under consideration, ask whether a specific person on the team would change what they do differently based on that number moving up or down. If nobody’s actions would change, it is not a KPI, it is trivia. Limiting the initial dashboard to three to five KPIs, tied directly to that test, keeps the whole system usable instead of overwhelming.
Step 2: Set Up Tracking Correctly
This is the unglamorous, technical part, and it is also the part that determines whether every number after this point is trustworthy or garbage. It starts with installing Google Tag Manager (GTM), a free tool that manages all your tracking codes (GA4, Meta Pixel, conversion tracking scripts) from a single interface instead of hard-coding them into your website.
Inside GTM, you set up specific event tags for actions that matter: form submissions, button clicks, purchases, phone number clicks. The mistake almost every beginner makes is assuming GA4 tracks conversions automatically out of the box. It does not, beyond a small set of default events. If you never configure a “Purchase Complete” or “Form Submitted” event as a Key Event inside GA4, your entire conversion reporting will show zero, no matter how much traffic and how many sales are actually happening. This single missed step in setup is behind a huge share of “our analytics is broken” complaints, which turn out to be “our analytics was never actually set up.” Anyone comfortable with basic technical setup and site implementation will find this step straightforward; anyone who is not should treat it as the first thing worth learning properly rather than skipping.
Step 3: Collect and Organize Data Consistently
Once tracking is live, data needs somewhere consistent to live. For small operations, a well-structured Google Sheet updated weekly works fine. For anything larger, connect GA4, Google Ads, and Search Console into a single Looker Studio dashboard so nobody has to log into three separate platforms to answer one question.
Consistency matters more than sophistication here. A simple spreadsheet updated every single week beats an elaborate dashboard that gets checked once a quarter. Set a fixed day, Monday morning works for most teams, and a fixed 30-minute block to pull the same core numbers every time: traffic by channel, conversion rate, cost per conversion, and top-performing content or campaigns.
Keep historical data in the same sheet rather than overwriting it week to week. A single row added every Monday, with a date column, builds a running trend line within a few months that becomes far more valuable than any individual week’s snapshot. Most of the real insight in marketing analytics comes from comparing periods against each other, not from staring at one isolated week in a vacuum.
Step 4: Analyze and Find the Patterns
This is where descriptive turns into diagnostic. Do not just record that Instagram traffic dropped 15%. Cross-check it against the posting calendar (did posting frequency drop?), against the algorithm (did Instagram roll out a known change that week?), and against seasonality (is this a normal dip compared to the same week last year?).
Look for correlations across data sources, not isolated numbers within one tool. If email conversion rate and Instagram engagement both dropped in the same week that a competitor launched a major sale, that context changes the entire read of the situation, from “our channels are underperforming” to “the market got temporarily more competitive,” which calls for a completely different response.
Step 5: Turn Insights Into Specific Action
Every analysis needs to end in a decision, and that decision needs an owner and a deadline, not just a note in a slide that nobody revisits. “Blog traffic converts at 1.2% while paid search traffic converts at 4.1%, so shift 20% of the content budget into paid search for the next 60 days and re-measure” is an action. “Blog traffic is underperforming, needs improvement” is not, it is an observation dressed up as a plan.
Build a simple feedback loop: decision made, date implemented, result after 30 or 60 days, keep or reverse. Without this loop, analytics becomes a reporting exercise that generates charts nobody acts on, which is functionally the same as not having analytics at all, just with extra steps and a bigger time cost attached.
Marketing Analytics Mistakes That Waste Time and Budget
Some mistakes show up so often they deserve their own section, because avoiding them saves more time than any tool ever will.
Chasing Vanity Metrics Over Business Metrics
Follower count, impressions, and likes feel good to report because the numbers usually go up and up looks like progress. But none of them pay salaries. A page with 50,000 followers and a 0.4% engagement rate is weaker than a page with 4,000 followers and a 6% engagement rate that actually converts. Before reporting any number, ask “does this connect to revenue, leads, or retention,” and if the honest answer is no, it belongs in a footnote, not the headline slide.
Ignoring Statistical Significance in A/B Tests
Running a test for two days, seeing Variant B slightly ahead, and declaring a winner is one of the most common analytics mistakes in the industry. Small sample sizes produce noisy results that reverse themselves the moment more data comes in. A proper A/B test needs enough traffic and enough time, typically at least one to two full business cycles, to reach statistical confidence, usually 95% or higher, before a result should actually change anything.
Mixing Up Correlation With Causation
Ice cream sales and drowning deaths both rise in summer. They are correlated. Neither one causes the other, heat causes both. Marketing data is full of this trap: a Instagram post goes viral the same week revenue spikes, and it is tempting to credit the post, when a product launch or a seasonal demand shift might be the real driver. Before crediting any single channel or campaign for a result, check whether other factors moved at the same time.
Not Documenting What Was Tried Before
Teams without a documented history of past campaigns, tests, and results end up re-running failed experiments every 12 to 18 months as new team members join and repeat old mistakes with no memory of why they were abandoned the first time. A simple shared log, campaign name, hypothesis, result, date, saves this. It also builds a reference library of what actually works for that specific business, which generic industry benchmarks can never fully replace. Reviewing real case studies and documented results from other businesses helps too, since seeing how someone else diagnosed a similar drop often shortcuts weeks of guesswork.
How to Build a Career in Marketing Analytics
Marketing analytics has become one of the more stable specializations inside digital marketing, partly because the skill compounds. Someone who can run a campaign and someone who can run a campaign and prove its ROI in a boardroom are paid very differently, and the gap keeps widening as budgets tighten.
The Core Skills You Actually Need
Spreadsheet fluency comes first, specifically pivot tables, VLOOKUP or XLOOKUP, and basic charting in Excel or Google Sheets. Beyond that, hands-on comfort with GA4 and Google Ads reporting is close to mandatory for most marketing roles today, not just dedicated analyst positions. SQL is a strong differentiator for anyone wanting to move into a senior analytics or marketing operations role, since it lets you pull custom data directly from a database instead of waiting on a data team. None of this requires a computer science background, it requires consistent, hands-on practice with real data, not just reading about the concepts.
Certifications and Credentials Worth Having
Google’s own certifications, the Google Analytics Individual Qualification (through Skillshop) and the Google Ads certifications, are free and carry real weight because they come directly from the platform being tested. Meta Blueprint offers equivalent certifications for Facebook and Instagram advertising. These are not magic tickets to a job, but they signal baseline competence to a hiring manager scanning fifty applications in an afternoon, and they force you to actually learn the platforms properly rather than picking things up haphazardly on the job.
Where This Skill Fits in a Marketing Career
Marketing analytics rarely exists as a standalone entry-level job title outside large companies. Far more commonly, it is a skill layered on top of another marketing role, a content marketer who also owns reporting, a social media manager who also runs the paid budget and tracks ROAS, a founder who needs to understand their own numbers well enough to raise funding or make hiring decisions responsibly. Building this skill alongside core digital marketing fundamentals, rather than treating it as a separate specialty to learn later, is generally the faster path, and a structured program like the Alpha Marketer Foundation Program is built around exactly that combination rather than teaching analytics in isolation from strategy and execution.
Conclusion
Marketing analytics is not about becoming a data scientist. It is about asking better questions of the numbers already sitting inside GA4, Ads Manager, and your email platform, and having the discipline to act on what those numbers say even when the answer is uncomfortable, like cutting a channel someone on the team personally likes running. What is marketing analytics, at its core, comes down to one habit: connecting every rupee spent to a measurable outcome, then repeating that check often enough that it becomes routine instead of a quarterly scramble.
Start small. Pick one campaign running right now, pull its cost, its conversions, and its cost per conversion this week, and write down one specific action based on what those three numbers show. That single habit, repeated weekly, builds the instinct that separates marketers who guess from marketers who know.
None of this needs to be perfect on day one. Dashboards will be messy, some numbers will not add up cleanly across platforms at first, and that is normal, not a sign of failure. The businesses that get real value out of marketing analytics are not the ones with the most sophisticated setup. They are the ones that showed up every single week, looked at the same handful of numbers honestly, and made one small, specific decision based on what those numbers actually said.
Frequently Asked Questions
What is marketing analytics in simple terms?
Marketing analytics is the process of collecting and analyzing data from marketing activities, like website traffic, ad performance, and email campaigns, to understand what is working and guide future decisions. It connects marketing actions directly to business results such as leads, sales, and revenue.
What is the difference between marketing analytics and digital marketing?
Digital marketing refers to the actual channels and tactics used to reach customers, such as social media, SEO, email, and paid ads. Marketing analytics is the measurement layer that sits on top of those activities, tracking their performance and telling you which ones are actually delivering results.
What are the main types of marketing analytics?
There are four main types: descriptive (what happened), diagnostic (why it happened), predictive (what is likely to happen next), and prescriptive (what action to take based on the data). Most beginners start with descriptive reporting and gradually build toward diagnostic and predictive analysis as their skills grow.
Which tool should a complete beginner start with?
Google Analytics 4 is the standard starting point because it is free, widely used across the industry, and directly connects to Google Ads and Search Console. Learning GA4 first gives a solid foundation before adding social media or email-specific tools.
Is Google Analytics 4 free to use?
Yes, GA4 is free for the vast majority of businesses. There is a paid enterprise version called Google Analytics 360 aimed at very high-traffic organizations, but the free version includes everything a small or mid-size business needs, including custom event tracking, funnel exploration, and predictive metrics.
How is ROI different from ROAS in marketing analytics?
ROI (Return on Investment) measures overall profit relative to total cost, including product cost, salaries, and overhead. ROAS (Return on Ad Spend) measures revenue generated purely against ad spend, without factoring in other costs. A campaign can show a strong ROAS while still delivering weak or even negative ROI once true costs are included.
What is a good conversion rate for a website?
Average conversion rates vary heavily by industry, but a commonly cited ecommerce benchmark is around 2% to 3%, while lead generation sites often see 3% to 5% depending on the offer and traffic quality. The more useful benchmark is not an industry average but your own historical performance, since that reflects your actual audience and offer.
Do I need to know coding or SQL to work in marketing analytics?
No, coding is not required to get started. Comfort with spreadsheets, GA4, and basic reporting tools covers the vast majority of marketing analytics work. SQL becomes valuable later for more advanced or senior roles that involve pulling custom data directly from databases, but it is not a barrier to entry.
How often should marketing analytics be reviewed?
A weekly review of core metrics (traffic, conversion rate, cost per conversion) catches problems early, while a monthly or quarterly deep dive is better suited for spotting longer-term trends and making bigger strategic decisions. Reviewing too infrequently means problems compound before anyone notices them.
What is attribution in marketing analytics and why does it matter?
Attribution is the method used to assign credit for a conversion to specific marketing touchpoints, such as a social ad, an email, or an organic search visit. It matters because different attribution models (last-click, first-click, multi-touch) can make the exact same customer journey look completely different, which directly affects which channels get more budget.
Can small businesses realistically use marketing analytics without a dedicated analyst?
Yes. Most of the core tools, GA4, Search Console, native social and email analytics, are free, and the fundamental process (set goals, track correctly, review weekly, act on findings) does not require a full-time analyst to run. It requires discipline and consistency far more than it requires headcount or budget.
What is the biggest beginner mistake in marketing analytics?
Tracking too many metrics without a clear goal behind any of them. Beginners often turn on every available report in GA4, generate an overwhelming amount of data, and never actually act on any of it. Starting with two or three KPIs tied directly to a specific business goal produces far better results than tracking everything available.
Is marketing analytics only relevant for large companies?
No. The underlying tools, GA4, Search Console, and native social or email analytics, are free and scale down to a business with one product and one landing page. The core discipline of setting goals, tracking correctly, and reviewing numbers weekly applies exactly the same at a small scale, and arguably matters more, since small budgets have far less room to absorb wasted ad spend.
How long does it take to see useful results from a new analytics setup?
Basic reporting can start showing useful patterns within two to three weeks once tracking is configured correctly, though a full month of data is usually needed before drawing confident conclusions about channel performance. Anything shorter tends to be too noisy to act on with real confidence, especially for lower-traffic sites or campaigns with smaller budgets.
What is the difference between a KPI and a metric in marketing analytics?
A metric is any measurable number, page views, likes, email opens, there can be dozens on a single dashboard. A Key Performance Indicator (KPI) is a specific metric chosen because it directly reflects progress toward a defined business goal. Every KPI is a metric, but not every metric deserves to be treated as a KPI.