


Most website owners find out Google Search Console exists only after something breaks. Traffic drops 40% overnight, a client calls asking why their homepage vanished from search results, or a blog post that used to rank on page one quietly slides to page four. That is usually the moment someone finally opens Google Search Console for the first time, and honestly, that is backwards. Google Search Console should be the first tool anyone touches when they launch a website, not the emergency room they visit after the damage is done.
Here is the thing about Google Search Console: it is free, it is built by Google itself, and it tells you exactly what Google sees when it looks at your site. Not what you think Google sees. Not what a paid SEO tool estimates based on third-party data. The actual, unfiltered truth, straight from the source that decides whether your pages show up in search results at all. And yet a huge number of site owners, students learning SEO for the first time, and even some working marketers barely scratch the surface of what this tool actually does.
This guide walks through Google Search Console from zero. What it is, how to set it up correctly, how to read every major report without getting lost, and how to actually use the data to grow organic traffic instead of just staring at graphs. By the end, you will know how to catch indexing problems before they tank your rankings, how to find keyword opportunities sitting right under your nose, and which mistakes quietly cost beginners months of visibility.
Think about how many hours get spent guessing. Guessing why a page stopped ranking. Guessing whether Google even knows a page exists. Guessing why traffic dipped after a redesign. Almost every one of those guesses has a real answer sitting inside Google Search Console, already calculated, already logged, and completely free to access. The tool has been rebuilt a few times over the years, old sections renamed, new reports added, but the core promise has stayed the same since it launched under its old name, Google Webmaster Tools: show site owners exactly what Google’s crawlers are doing, without the mystery.
Quick Summary
- Google Search Console is a free Google tool that shows exactly how your website appears in search results, including clicks, impressions, indexing status, and technical errors.
- Set up a Domain property whenever possible since it captures data across http, https, www, and non-www versions of your site in one place.
- The Performance report is where most beginners find quick-win keywords: search terms where you already rank on page two but haven’t optimized the content yet.
- The Coverage report (now split across Indexing sections) is your early warning system for pages Google can’t or won’t index, and it should be checked weekly, not once a year.
- Core Web Vitals and Mobile Usability reports catch technical issues that quietly suppress rankings even when your content is genuinely good.
- The single biggest beginner mistake is treating Google Search Console as a one-time setup task instead of a weekly habit.
What Is Google Search Console and Why It Matters for Every Website
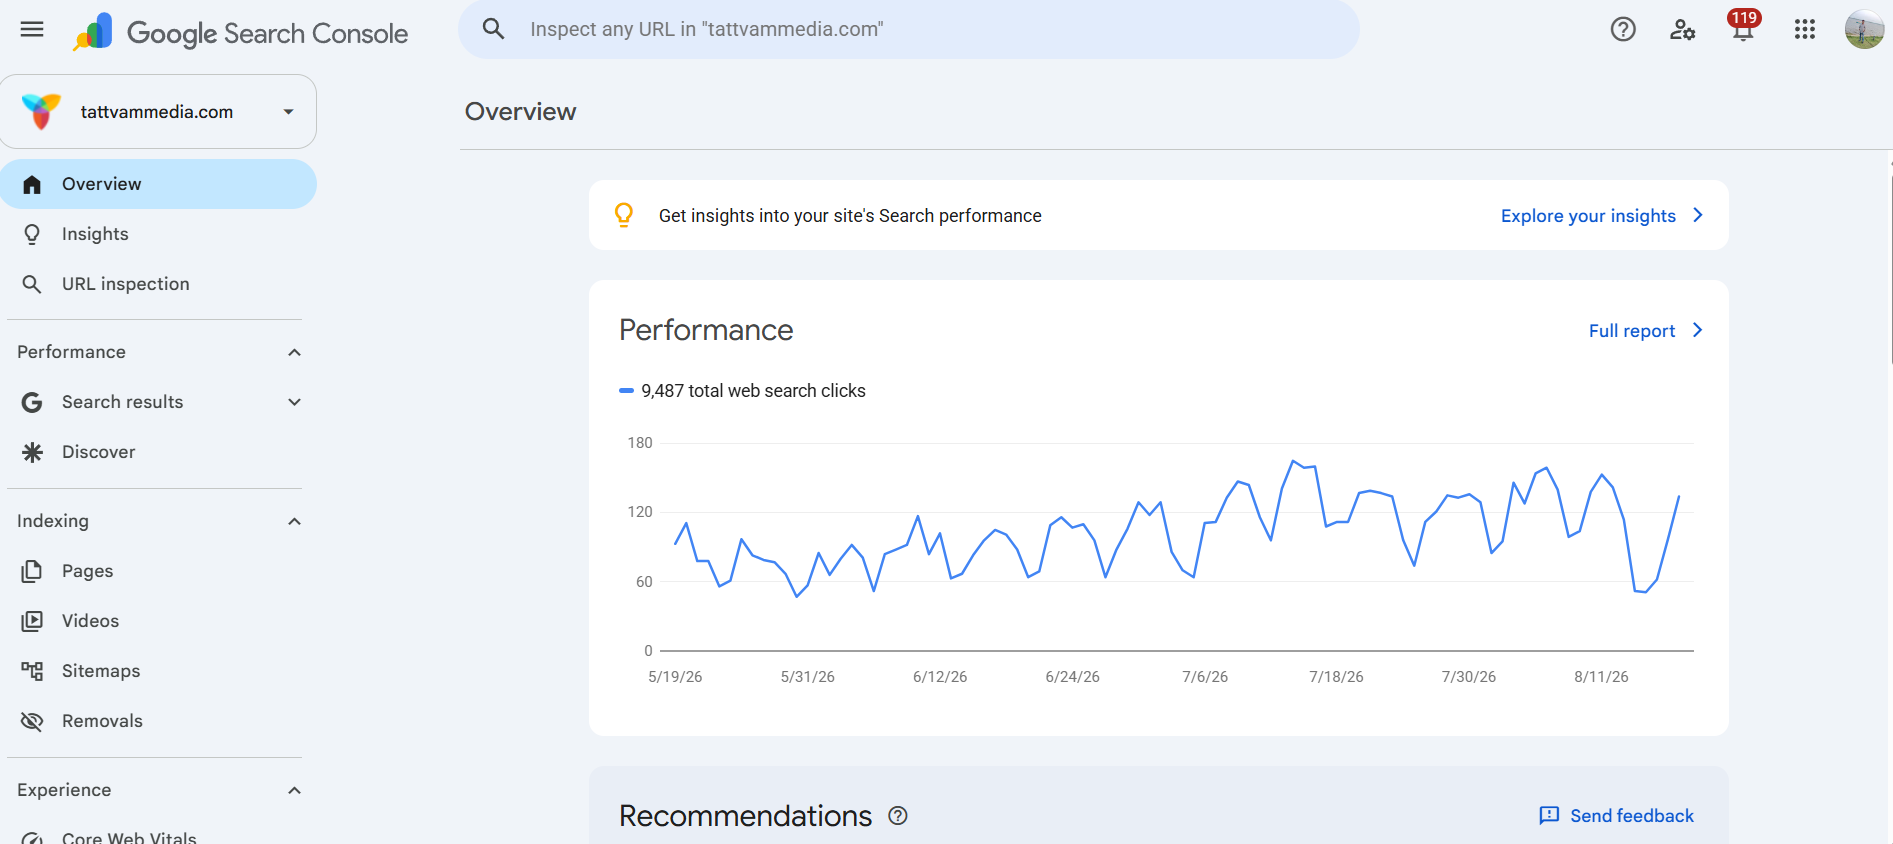
Google Search Console is a free web service from Google that lets website owners monitor, maintain, and troubleshoot how their site performs in Google Search results. It shows you real data straight from Google’s index: which queries bring people to your pages, how many times your pages appeared in search results, whether Google can actually crawl and index your content, and where technical errors are quietly blocking your visibility.
What makes Google Search Console different from every other analytics tool is the source of the data. Google Analytics tells you what happened after someone landed on your site. Google Search Console tells you what happened before that, inside Google’s own search results page, where the decision to click or scroll past your listing actually gets made. That distinction matters more than most beginners realize, because a site can have perfect on-page SEO and still get zero traffic if Google never indexes the page in the first place.
The tool is genuinely built for anyone, not just technical SEO specialists. Small business owners use it to confirm their homepage still shows up for their own business name. Bloggers use it to see which posts are actually pulling search traffic versus which ones just sit there unread. Developers use it to catch crawl errors before a redesign quietly tanks the whole site’s visibility. Everyone gets something different out of the same dashboard, which is part of why it is worth learning properly instead of treating it as a one-time checkbox during site launch.
How Google Search Console Actually Works Behind the Scenes

Google Search Console pulls data directly from Google’s crawling and indexing systems, the same infrastructure that decides which pages appear in search results and in what order. When Googlebot crawls your site, it logs every page it finds, every error it hits, and every signal it uses to rank that page. Search Console gives you a window into that process instead of leaving you to guess.
This is why the data inside Search Console sometimes looks different from what a third-party rank tracker shows. Tools like Ahrefs or Semrush estimate rankings using their own crawlers and sample data sets. Google Search Console shows you actual impressions and actual average position, calculated from real searches that real people typed into Google. If a competitor’s tool says you rank at position 8 for a keyword but Search Console shows position 14, trust Search Console. It is closer to the truth every time because it comes straight from Google’s own logs.
There is a data lag worth knowing about too. Most reports inside Google Search Console show data up to 2 or 3 days behind, and the Performance report specifically runs on a rolling basis rather than real time. So checking Search Console the morning after publishing a post and seeing zero impressions does not mean the post failed. It usually means the data has not caught up yet, or the page has not been crawled and indexed on Google’s timeline. Patience matters more than panic in the first week after publishing anything new.
Google Search Console vs Google Analytics: What’s the Difference
People confuse these two tools constantly, and it is worth clearing up early because they solve completely different problems. Google Analytics measures behavior after a visitor lands on your site: how long they stayed, which pages they viewed, whether they converted. Google Search Console measures visibility before that click even happens: how often your pages showed up in search results, what position they held, and what search terms triggered the impression.
Think of it this way. Google Search Console tells you how many people saw your listing in search results and how many of them clicked. Google Analytics tells you what those clickers did once they arrived. You genuinely need both, but if you had to pick one to master first as a beginner, pick Google Search Console. Traffic problems almost always start upstream, in visibility and indexing, long before they show up as a bounce rate issue inside Analytics.
Here’s a scenario that shows the gap clearly. A blog post gets 3,000 sessions a month according to Analytics, and everything downstream looks fine: decent time on page, reasonable bounce rate, a few conversions. But open Search Console for that same URL and impressions have dropped 60% over the last quarter while click-through rate stayed flat. Analytics alone would never catch that, because it only measures people who actually arrived. The demand for that page in search results is quietly shrinking, maybe because a competitor published a more thorough guide, or because the search intent behind that keyword shifted. Search Console catches the erosion months before it shows up as a revenue problem.
Who Should Be Using Google Search Console
Every single website with any ambition of showing up in Google search results should have Google Search Console set up, full stop. That includes solo bloggers, small business owners with a five-page website, e-commerce stores, SaaS companies, and agencies managing dozens of client sites. There is no traffic threshold where this tool stops being useful. A brand-new site with zero traffic benefits from Search Console just as much as a site pulling 500,000 monthly visitors, because indexing problems and technical errors do not care how popular your site already is.
If someone building a career in SEO skips learning Google Search Console properly, that is a real gap, because almost every SEO audit, every technical fix, and every content decision eventually loops back to data sitting inside this one tool. Agencies managing multiple client sites lean on it even harder, since it is usually the fastest way to prove a fix actually worked, showing a client indexed pages climbing from 340 to 890 after cleaning up a crawl issue speaks louder than any strategy deck ever could.
Freelancers and small business owners tend to skip Search Console for a different reason: nobody ever showed them why it matters or how to read it without getting lost in jargon. That gap is exactly what this guide is meant to close, one report at a time, without assuming prior SEO experience walking in.
[Screenshot: Google Search Console Overview dashboard showing Performance, Coverage, and Core Web Vitals summary cards]
How to Set Up Google Search Console From Scratch
Setting up Google Search Console takes about ten minutes if you do it right, but a lot of beginners get tripped up on the property type decision right at the start, and that one choice affects how clean your data looks for the entire lifetime of the site. Getting the setup right the first time saves you from re-verifying, losing historical data, or staring at split reports later.
Choosing Between Domain Property and URL-Prefix Property
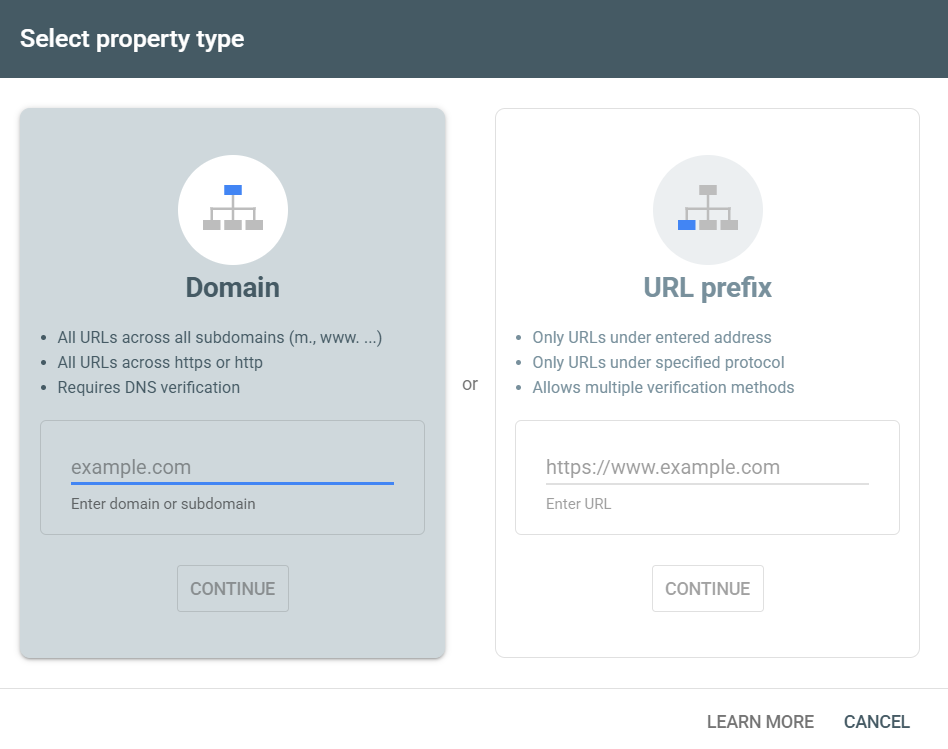
Google Search Console offers two property types, and picking the wrong one is the most common beginner mistake at setup. A Domain property covers every version of your domain in one unified report: http, https, www, non-www, and all subdomains. A URL-prefix property covers exactly one version, so https://example.com and https://www.example.com would need two separate properties if you set them up that way.
For almost every site, go with the Domain property. It gives you the full picture without fragmenting your data across multiple listings. The only real reason to use URL-prefix instead is if you specifically need to monitor a single subdirectory or subdomain in isolation, say if you are running a blog on a subdomain and want its performance data kept separate from the main site. Domain property setup requires DNS verification, which sounds intimidating but is really just adding one TXT record through your domain registrar, something most hosting providers walk you through with copy-paste instructions.
A mistake that shows up a lot on older sites: someone set up a URL-prefix property for https://www.example.com back in 2019, migrated the site to https non-www at some point, and never added a second property. Years of historical data end up split across two abandoned listings, and the “real” current property shows almost no history when someone finally checks it. Setting up a Domain property from day one avoids that mess entirely, since it automatically rolls up every protocol and subdomain variation without needing to predict future URL changes.
Verifying Ownership: Every Method Explained
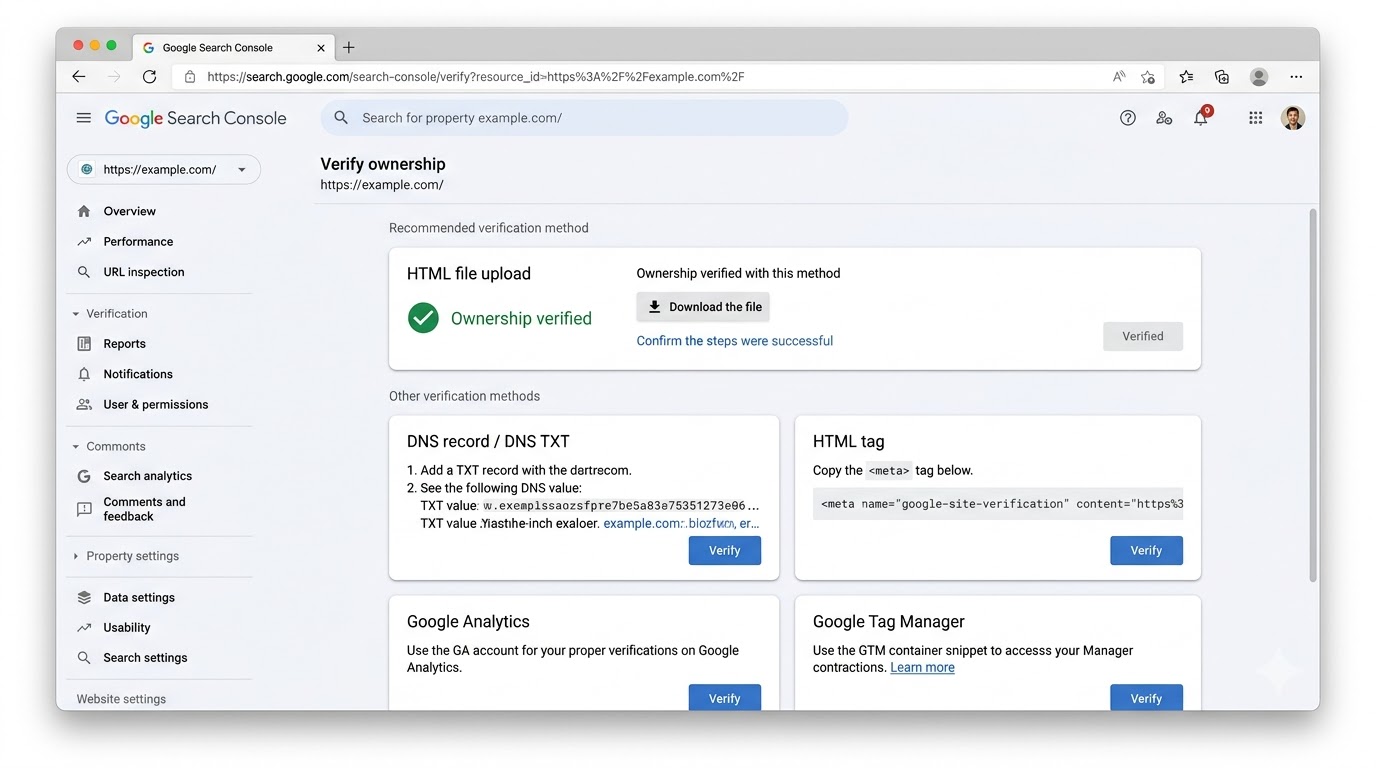
Google needs proof you actually own the site before it hands over search data, and it offers five verification methods depending on which property type you chose. For Domain properties, DNS TXT record verification is the only option, and it is done through your domain registrar’s DNS settings, not your website’s code.
For URL-prefix properties, you get more flexibility. HTML file upload means downloading a small verification file from Search Console and uploading it to your site’s root directory. HTML tag verification means pasting a meta tag into your site’s header, which most CMS platforms like WordPress let you do through a plugin without touching code directly. Google Analytics verification works automatically if you already have Analytics installed with admin access on the same Google account. Google Tag Manager verification works the same way if GTM is already firing on the site. Pick whichever method matches what you already have installed, since re-verification headaches usually come from choosing a method that requires access you do not actually have.
One thing that trips up agencies specifically: verification is tied to a Google account, not to the site itself. If a freelancer verifies a client’s property using their own personal Gmail and then the relationship ends, the client can lose access to years of historical Search Console data unless ownership gets transferred properly beforehand. Always add the client’s own business Google account as an Owner, not just a User, right at setup, so nobody gets locked out later over something this avoidable.
Connecting Google Search Console to Google Analytics
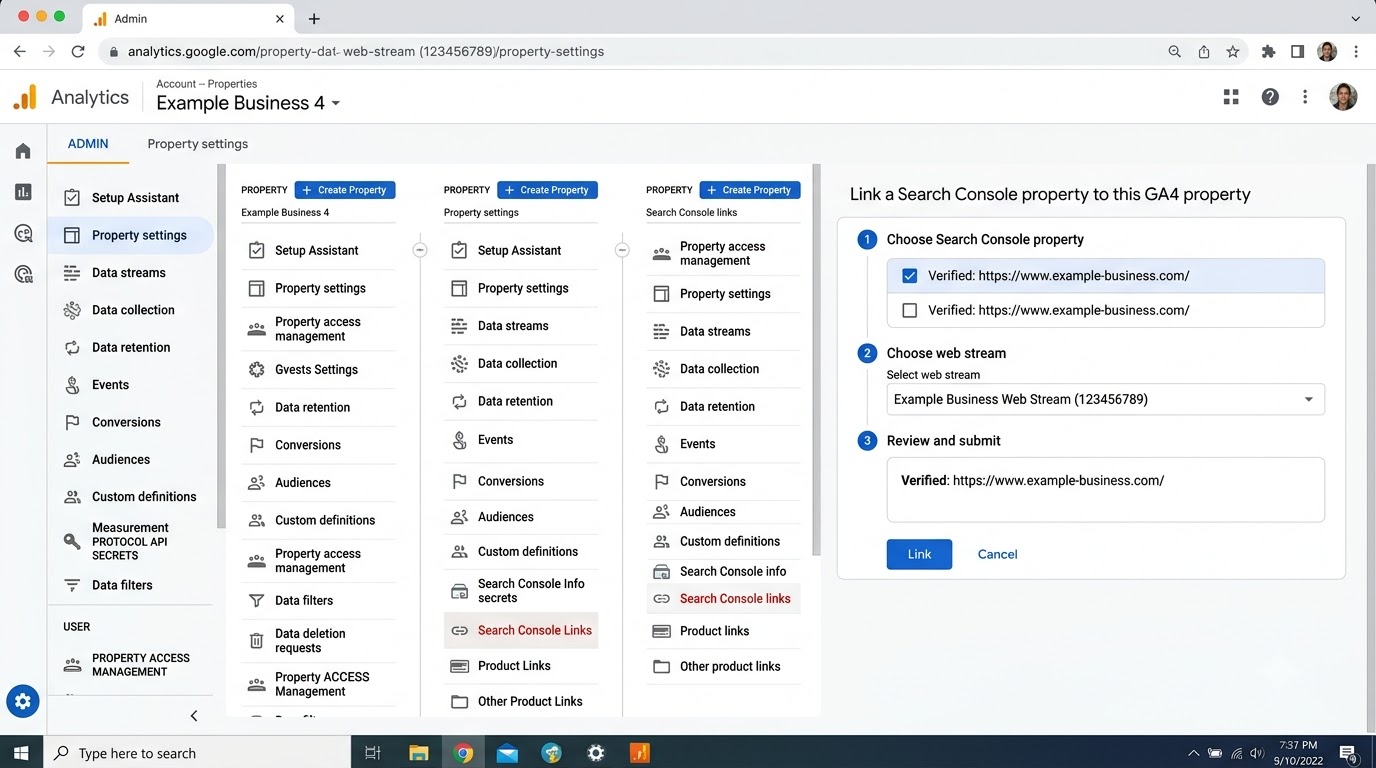
Linking Google Search Console to Google Analytics 4 pulls Search Console data directly into your Analytics reports, which saves constant tab-switching when you are analyzing organic performance alongside on-site behavior. Inside Google Analytics, go to Admin, then Property Settings, then Product Links, and select Search Console Links. From there you pick the verified Search Console property and confirm the connection.
Once linked, you can see landing page performance broken down by search query without leaving Analytics, and you get access to the Search Console reports collection inside GA4’s library, including Queries and Landing Pages reports that blend both data sources. This connection is one-directional though: it pulls Search Console data into Analytics, not the other way around, so you still need to check Search Console directly for the deeper crawling and indexing reports.
Only one Search Console property can be linked per Analytics property at a time, which matters if a site has both a Domain property and a leftover URL-prefix property sitting in the account. Link the Domain property, since it carries the fuller data set, and unlink or ignore the older URL-prefix property once historical data has been reviewed. Leaving both connected does not cause errors, but it does create confusion later about which one is feeding the Analytics reports.
Submitting Your Sitemap in Google Search Console
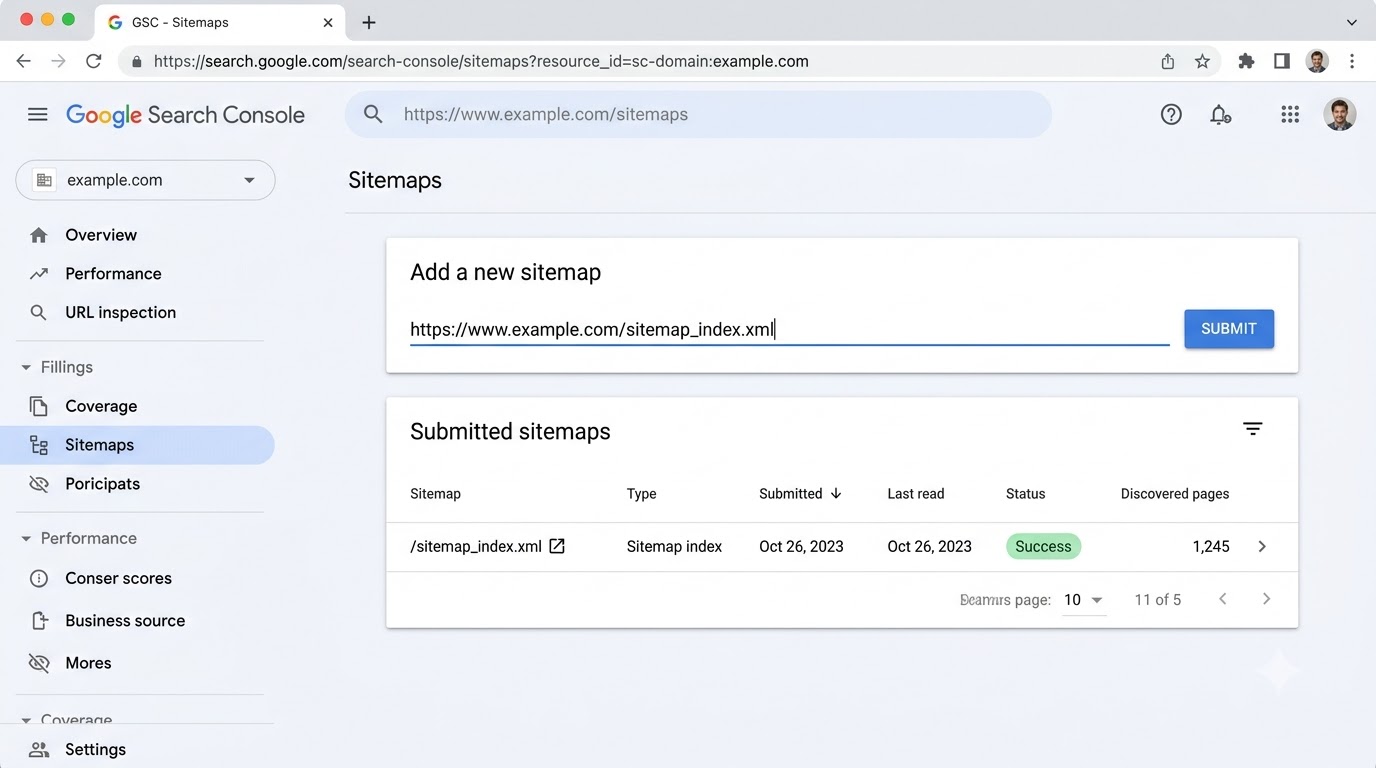
A sitemap is an XML file listing every page you want Google to know about, and submitting it inside Google Search Console speeds up discovery significantly compared to waiting for Googlebot to find pages organically through links. Inside Search Console, click Sitemaps in the left sidebar, then enter your sitemap URL, usually something like sitemap.xml or sitemap_index.xml, and hit submit.
Most modern CMS platforms generate this file automatically. WordPress sites running Yoast SEO or Rank Math create one at yoursite.com/sitemap_index.xml without any manual work. Shopify stores get one automatically at yoursite.com/sitemap.xml. If your sitemap submission shows a “Couldn’t fetch” error, check that the file is actually accessible by pasting the URL directly into a browser first, since a broken sitemap link is a more common cause of that error than any Search Console bug.
Submitting a sitemap does not guarantee indexing on its own. It is a discovery mechanism, basically a map handed to Googlebot saying “here is everything worth looking at.” Google still decides independently whether each URL on that map is worth crawling and indexing based on its own quality signals. Sites sometimes assume submitting a sitemap is the finish line, when really it is closer to the starting gun. The Coverage report, covered in the next section, is where you actually confirm those submitted URLs made it into the index.
[Screenshot: Google Search Console Sitemaps report showing a successfully submitted and processed sitemap.xml file]
Understanding the Core Reports Inside Google Search Console
This is where most of the real value sits, and also where most beginners get overwhelmed because there are close to a dozen reports crammed into the left sidebar. You do not need to master all of them on day one. Five reports do about 90% of the heavy lifting for most site owners, so start there.
A reasonable order to learn them in: Performance first, since it answers the question everyone actually cares about, which is whether the site is getting found in search at all. Coverage or Indexing second, since it explains why some pages might be missing from that Performance data entirely. Core Web Vitals and Mobile Usability third, since these catch technical issues that suppress rankings even on pages that are technically indexed fine. Links last, since it is more of a supporting signal than something checked daily.
Performance Report: Clicks, Impressions, CTR, and Position
The Performance report is the one you will open most often, and it tracks four core metrics for every query and page: clicks, impressions, click-through rate, and average position. Clicks are self-explanatory. Impressions count how many times your page showed up in a search results page, even if nobody clicked it. Click-through rate is clicks divided by impressions, showing what percentage of people who saw your listing actually clicked it. Average position is where your page typically ranked for that query, averaged across all the times it appeared.
The real skill here is filtering. Filter by query to see which search terms drive traffic to a specific page. Filter by page to see every query bringing traffic to one URL. Sort by impressions with low CTR to find pages that show up a lot but get ignored, which usually means the title tag or meta description needs work. Sort by average position between 11 and 20 to find pages sitting on page two, which are often the fastest wins in SEO because a small content update can push them onto page one where click-through rates jump dramatically.
The date comparison feature deserves more attention than it gets too. Instead of just looking at one flat date range, click Compare and set it to compare the last 28 days against the previous 28 days, or year over year for seasonal businesses. This surfaces queries that are genuinely trending up or down, not just sitting at a static number, which matters a lot when deciding where to spend the next content update. A query climbing from 200 impressions to 900 impressions month over month deserves attention now, before the competition catches up on it too.
Also worth knowing: the Performance report defaults to Web search results only, but a dropdown lets you switch to Image search, Video search, News, and Discover separately. A site with a lot of visual content, recipe blogs and product photography sites especially, often finds a meaningful chunk of traffic hiding in the Image tab that never shows up when only checking the default Web view.
Coverage (Indexing) Report: Fixing Errors and Exclusions
Google renamed this report a few times, and depending on your account it might show up as “Indexing” or under “Pages” in the sidebar, but the function stays the same: it tells you exactly which URLs on your site are indexed, which are excluded, and why. This report is split into categories like Error, Valid with warnings, Valid, and Excluded, and each category breaks down further into specific reasons.
Common exclusion reasons include “Crawled, currently not indexed,” which means Google visited the page but decided not to include it in search results, often because the content is too thin or too similar to another page already indexed. “Discovered, currently not indexed” means Google knows the page exists but hasn’t crawled it yet, usually a crawl budget issue on larger sites. “Duplicate without user-selected canonical” flags pages Google considers copies of another URL without a clear signal telling it which version to prefer. Ignoring this report for months is how sites end up with hundreds of pages that were never actually indexed, silently costing traffic nobody noticed was missing.
Two other categories worth knowing by name because they show up constantly on real sites. “Blocked by robots.txt” means the site’s own robots.txt file is telling Googlebot not to crawl that URL, which sounds obvious but happens accidentally more than people expect, usually after a staging site’s robots.txt file gets accidentally pushed live during a migration. “Page with redirect” simply means the URL redirects elsewhere, so Google indexed the destination instead, which is expected behavior and not something to fix unless the redirect itself is broken or unintended.
The “Excluded” category is not automatically bad either, and this trips up beginners who panic at a large exclusion number. Pagination pages, filtered category URLs on an e-commerce site, and intentionally noindexed thank-you pages all show up here by design. The report becomes genuinely useful when you sort by the “Valid” count trend over time and watch for unexpected drops, and separately scan the excluded reasons for anything that should not be excluded, like a cornerstone blog post that accidentally picked up a noindex tag during a template update.
Core Web Vitals and Page Experience Report
Core Web Vitals measure real-world loading performance and interactivity using three metrics: Largest Contentful Paint, which measures how long the main content takes to load; Interaction to Next Paint, which measures responsiveness to clicks and taps; and Cumulative Layout Shift, which measures visual stability, basically whether elements jump around while the page loads. Google Search Console pulls this data from the Chrome User Experience Report, meaning it reflects actual visitor experiences, not a lab simulation.
Pages get grouped into Good, Needs Improvement, or Poor for each metric, and the report shows exactly which URLs fall into each bucket along with the specific issue. A site loaded with unoptimized images or render-blocking JavaScript often shows a cluster of “Poor” LCP scores across most pages. This is heavily a web development problem as much as an SEO one, since fixing it usually means compressing images, deferring non-critical scripts, or switching to a faster hosting setup rather than tweaking content.
Google groups similar URLs into templates for this report rather than listing every single page separately, which sometimes confuses people who expect to see their exact page URL listed. If ten blog posts all use the same template and share the same layout issue, they get bundled together under one representative example. Fixing the root template issue, say a hero image that isn’t lazy-loaded, resolves the problem across every page using that template at once, which is actually more efficient than chasing individual URLs one by one.
Worth being specific about the thresholds too. Largest Contentful Paint needs to come in under 2.5 seconds for “Good.” Interaction to Next Paint needs to stay under 200 milliseconds. Cumulative Layout Shift needs to stay under 0.1. These are not arbitrary targets, they are the exact benchmarks Google itself uses to bucket pages into the Good, Needs Improvement, and Poor categories shown in the report.
Mobile Usability Report
With most search traffic coming from mobile devices, Google indexes and ranks primarily using the mobile version of your site, a system called mobile-first indexing. The Mobile Usability report flags specific problems that make pages hard to use on a phone: text too small to read without zooming, clickable elements placed too close together, content wider than the screen causing horizontal scrolling, or viewport configuration missing entirely.
Fixing these issues is usually straightforward once you know what to look for. Text size problems trace back to CSS font-size rules that were set for desktop and never adjusted for smaller screens. Clickable element spacing issues often come from buttons or links styled without enough padding around them. Since Google evaluates the mobile version first, a site that looks perfect on desktop but scores poorly here is genuinely at risk of losing rankings, not just annoying mobile visitors.
Older sites migrated from a desktop-only design era are the usual culprits here, especially ones running on outdated WordPress themes that were never rebuilt with a mobile-first approach. A quick manual check helps too: open any page on an actual phone, not just a resized browser window, since browser dev tools’ mobile emulation sometimes misses spacing and tap-target issues that show up on a real touchscreen. If a “Poor” score shows up for a page that looks fine on a laptop, that gap between what looks fine and what actually tests fine is exactly why this report exists.
Links Report: Internal and External Backlinks
The Links report shows two categories: external links pointing to your site from other domains, and internal links connecting pages within your own site. The external links section shows top linking sites, top linked pages, and top linking text, giving a rough picture of your backlink profile. Google Search Console only shows a sample though, not the complete list, unlike dedicated backlink tools.
The internal links data is genuinely underused by beginners. It shows exactly how many internal links point to each page on your site, and pages with very few internal links often struggle to rank even with good content, because internal linking is one of the clearest signals telling Google which pages matter most on your site. If a cornerstone page only has two internal links pointing to it, that is a fixable problem, and fixing it is often faster than building new backlinks from scratch.
A practical exercise worth doing quarterly: export the internal links report, sort ascending, and look at whichever important pages sit near the bottom with the fewest links pointing at them. Then go find 5 to 10 relevant older posts and add a natural contextual link to that underlinked page. This alone has moved pages up several ranking positions on sites without touching the content itself, purely because it changed how much authority Google’s crawler assigns to that URL relative to everything else on the domain.
[Screenshot: Google Search Console Performance report filtered by query, sorted by impressions with a low click-through rate column visible]
How to Use Google Search Console for Real SEO Growth
Knowing what the reports mean is step one. Actually using that data to grow traffic is a different skill, and it is the part most tutorials skip because it takes more judgment than just clicking through a dashboard tour. This is also the part that separates someone who “has Google Search Console installed” from someone who actually uses it to make decisions week over week. The dashboard by itself does not fix anything. What fixes rankings is the pattern of pulling data, spotting a gap, making a specific change, and then coming back a few weeks later to check whether that change actually moved the number it was supposed to move.
Finding Quick-Win Keywords Using the Performance Report
Here is a specific, repeatable process. Open the Performance report, set the date range to the last 3 months, and sort by impressions descending. Look for queries sitting at average position 8 through 20 with decent impression volume, say 100 or more. These are keywords Google already considers your page relevant for, just not relevant enough to break into the top results yet.
For each of these, open the page currently ranking and compare it against what is sitting in positions 1 through 5 for that same query. Usually the gap comes down to one of three things: the content is thinner than the top results, the page is missing a clear answer to the search intent near the top, or the title tag doesn’t match what people are actually searching for. Updating the content to close that gap, then requesting reindexing through the URL Inspection tool, often moves a keyword from position 14 to position 6 within a few weeks, which is a far faster win than building new content from scratch and waiting months for it to rank at all.
Look for the queries tab specifically and filter for branded terms too, since branded keywords, someone typing the exact business or blog name, tend to sit at position 1 automatically and shouldn’t be mistaken for genuine ranking wins. Strip those out first so the quick-win list only shows non-branded, informational, or commercial queries where competition genuinely exists and improvement effort actually pays off.
A second variation of this tactic: filter the Performance report by a specific page instead of a query, and look at all the different search terms already bringing traffic to it. Sometimes a page ranks for a keyword variant nobody intentionally targeted, say a how-to guide accidentally ranking for a related question buried in the comments section. Adding a dedicated subheading answering that exact question directly, using close to the same phrasing searchers used, often pulls that query up several positions because the content now matches intent more precisely than before.
Using URL Inspection Tool to Diagnose Indexing Problems
The URL Inspection tool sits at the top of Google Search Console and lets you check the exact indexing status of any single URL on your verified property. Paste in a URL and it shows whether the page is indexed, when it was last crawled, which canonical URL Google chose, and whether mobile usability issues were detected on that specific page.
If a page shows as “URL is not on Google,” the tool tells you why, whether that is a noindex tag, a robots.txt block, a canonical pointing elsewhere, or simply that Google hasn’t crawled it yet. Once you fix whatever the issue is, click “Request Indexing” directly from this tool to push the page into Google’s crawl queue faster than waiting for organic discovery. This is especially useful right after publishing a new post or fixing a technical issue, since it can shave days off the normal indexing timeline.
There is a daily quota on manual indexing requests, and it is not unlimited, so this tool works best as a targeted fix for important individual URLs rather than a way to force-index dozens of pages in one sitting. If a whole batch of pages needs reindexing after a site-wide fix, resubmitting the sitemap and letting Google’s normal crawl process handle it is more realistic than manually requesting every single one. The “Test Live URL” button inside the Inspection tool is also worth using separately from a plain status check, since it renders the page exactly as Googlebot sees it right now, catching cases where a page looks fine in a browser but is technically returning a different response to crawlers, something that happens more often than expected with certain caching or bot-detection setups.
Fixing Manual Actions and Security Issues
Two sections in Google Search Console you genuinely never want to see anything in: Manual Actions and Security Issues. Manual Actions appear when a human reviewer at Google has determined your site violates Search Essentials guidelines, things like unnatural links, thin affiliate content, or cloaking. A manual action can tank an entire site’s visibility overnight, and recovering requires fixing the underlying issue and submitting a reconsideration request explaining exactly what changed.
Security Issues cover a different problem: malware infections, hacked content, or deceptive pages injected by an attacker. If Google detects this, it may show warnings to users before they even click through to your site in search results, which destroys trust and traffic fast. Checking these two sections should be part of a monthly Search Console routine, not something you only think about after traffic has already crashed.
Recovery from a manual action is not instant either. Fix the actual problem first, whether that means disavowing a batch of spammy backlinks or removing thin doorway pages, then write a reconsideration request that explains specifically what was found and specifically what changed, not a generic apology. Google’s team reviews these manually, and vague requests without evidence of an actual fix tend to get rejected and sent back, which just adds more weeks of lost visibility on top of what already happened.
Tracking Rich Results and Structured Data Errors
Structured data, also called schema markup, is code added to your pages that tells Google exactly what type of content it is looking at: a recipe, a product, a review, an FAQ, an event. When implemented correctly, it can trigger rich results in search, things like star ratings, price ranges, or FAQ dropdowns shown directly in the search listing, which noticeably improve click-through rates.
Google Search Console’s Enhancements section shows separate reports for each structured data type currently detected on your site, flagging both valid items and errors. A common error is a required field missing from Review schema, like the author name, which prevents the rich result from showing even though the rest of the markup is technically correct. Fixing structured data errors is usually a five-minute code fix once you know exactly which field is missing, and the report tells you precisely that.
FAQ schema is worth calling out specifically since it is one of the easier wins for beginners. Adding it to an existing FAQ section on a page, using the exact question and answer text already visible on the page, can trigger expandable dropdown results directly in the search listing, pushing a single result to take up noticeably more space on the results page. WordPress users can add this through plugins like Rank Math or Schema Pro without writing raw JSON-LD by hand, and the Enhancements report will confirm within a few days whether Google picked it up correctly.
[Screenshot: Google Search Console URL Inspection tool showing a page’s live indexing status and mobile usability check]
Google Search Console Mistakes Beginners Make
A lot of the value of this tool gets lost simply because people don’t build the habit of checking it regularly or misread what the numbers are actually telling them. These mistakes show up constantly, on brand-new sites and established ones alike, and honestly, most of them are not complicated technical failures. They are habit failures, the kind that come from setting a tool up once and then never opening it again until something visibly breaks.
Ignoring the Coverage Report for Months
The single most expensive mistake is setting up Google Search Console once, glancing at the Performance report occasionally, and never opening the Coverage or Indexing report again. Indexing problems compound silently. A single blocked page might not matter much, but a robots.txt misconfiguration blocking an entire folder, or a plugin update that accidentally added noindex tags site-wide, can wipe out a huge chunk of a site’s visibility, and it often goes unnoticed for weeks because traffic decline looks gradual on the surface until someone actually checks the indexing numbers.
Make it a habit to check the Coverage or Pages report at least once a week, or immediately after any major site change: a redesign, a CMS migration, a plugin update, or a bulk content edit. Catching a spike in “Excluded” pages within days instead of months is the difference between a quick fix and months of lost traffic.
Setting up email alerts helps too. Google Search Console sends automatic email notifications when it detects a significant increase in indexing errors or a new manual action, but only to the email address tied to the verified account, so it is worth double-checking that notifications are actually enabled under the account settings and that the inbox receiving them is one someone actually checks regularly, not an old address nobody monitors anymore.
Not Submitting Sitemap Updates After Site Changes
Sitemaps are not “set it and forget it.” When you add new pages, delete old ones, or restructure your URL patterns, your sitemap needs to reflect that, and ideally your CMS handles this automatically. But when sites migrate platforms, say moving from Wix to WordPress, or restructure URLs for SEO reasons, the old sitemap sometimes still points to dead URLs while new ones are missing entirely.
Check the Sitemaps report periodically to confirm the “Discovered URLs” count roughly matches your actual published page count. A big mismatch usually means something broke in how the sitemap gets generated, and it is worth investigating rather than assuming everything is fine just because the sitemap technically submitted without an error message.
Multiple sitemaps are also worth considering once a site grows past a few hundred pages. A sitemap index file that splits content into separate files, one for blog posts, one for product pages, one for category pages, makes it much easier to isolate exactly where an indexing problem is coming from. If the blog sitemap shows 95% indexed but the product sitemap shows only 40%, that immediately narrows the investigation down to the product template rather than requiring a search through the entire site.
Misreading Impressions vs Clicks
Beginners often panic when they see impressions climbing but clicks staying flat, assuming something is broken. Usually nothing is broken. It just means the page is showing up in search results but not earning clicks, which points to a title tag or meta description problem, not a ranking problem. A page can sit at position 3 and still get a low click-through rate if the title doesn’t clearly match what the searcher wanted, or if a competitor’s listing has a more compelling snippet next to it.
The fix here is almost never “build more backlinks” or “add more content.” It is usually rewriting the title tag to more directly match search intent, and testing a new meta description that gives the searcher a concrete reason to click over the other nine listings on the page.
A quick benchmark that helps put a specific number on this: average click-through rate for position 1 tends to sit somewhere around 25 to 30%, dropping to roughly 10 to 15% by position 5, and falling below 3% once a page slips past position 10. If a page sits at position 3 with a click-through rate under 5%, that gap between its actual CTR and the expected CTR for that position is the clearest possible signal that the listing itself, not the ranking, needs work.
Confusing Indexed vs Crawled Pages
These two terms get used interchangeably by beginners, but they mean different things inside Google Search Console. Crawled means Googlebot visited the page and read its content. Indexed means Google decided to actually store that page in its search index and consider it eligible to show up in results. A page can be crawled without ever being indexed, which is exactly what the “Crawled, currently not indexed” status in the Coverage report describes.
This distinction matters because the fix is different depending on which stage the problem sits at. If a page isn’t being crawled at all, check robots.txt and internal linking. If it is crawled but not indexed, the problem is almost always content quality or duplication, meaning Google looked at the page and decided it wasn’t worth including, which usually means it needs to be more substantial, more original, or more clearly differentiated from similar pages already on the site.
A related confusion: people assume submitting a page through URL Inspection guarantees it gets indexed immediately. It does not. Requesting indexing only pushes the URL higher in the crawl queue, it does not override Google’s own quality assessment of whether the page deserves a spot in the index. A thin, 200-word page with duplicate content elsewhere on the site will get crawled faster after a manual request, and then still get excluded for the exact same quality reasons it would have been excluded before, just faster.
For anyone systematically tracking these fixes across client sites, a case study approach, documenting before-and-after indexing numbers, makes it far easier to prove the value of this kind of technical cleanup work, both to clients and to yourself.
Treating Every Ranking Drop as a Penalty
The moment traffic dips, a lot of beginners jump straight to “Google penalized me,” when the actual cause is usually far more boring. Algorithm updates roll out constantly, and most of them are broad relevance adjustments, not penalties targeting a specific site. A genuine manual action shows up explicitly labeled inside the Manual Actions report, with a stated reason. If that report is empty, it is not a penalty, and chasing a penalty that does not exist wastes time that should go toward the actual cause, which is more often a content quality gap, a competitor publishing something stronger, or a technical issue caught in the Coverage report.
Before assuming the worst, cross-reference the timing of a traffic drop against known Google algorithm update dates, check the Manual Actions and Security Issues reports to rule those out first, and only then start investigating content and technical explanations. Skipping straight to panic mode without checking the actual data inside Search Console usually leads to the wrong fix being applied to the wrong problem.
Conclusion
Google Search Console is not optional if organic search matters to a website’s growth. It is the closest thing available to a direct line into how Google actually sees a site, and the data inside it, clicks, impressions, indexing status, Core Web Vitals scores, is more reliable than anything a third-party tool can estimate from the outside. Treat it as a weekly habit rather than a one-time setup task, and most technical SEO problems get caught within days instead of months.
None of this requires a budget. It requires attention. A site owner who checks Google Search Console every week and actually acts on what it shows will consistently outperform a site owner running expensive paid tools on top of a Search Console account they never open. The data is already sitting there, calculated and waiting, for free, straight from the source that makes every ranking decision. The only real cost is the ten minutes a week it takes to look.
The next concrete step is simple: open Google Search Console right now, check the Coverage or Pages report, and look for anything sitting in an unexpected exclusion category. If something looks off, that is the fix worth making before anything else on the SEO to-do list this week.
Frequently Asked Questions About Google Search Console
What is Google Search Console used for?
Google Search Console is used to monitor and troubleshoot how a website appears in Google Search results. It shows indexing status, search traffic data including clicks and impressions, technical errors, mobile usability issues, and Core Web Vitals performance, all sourced directly from Google’s own systems.
Is Google Search Console free to use?
Yes, Google Search Console is completely free for any website owner. There is no paid tier, no usage limit on properties for personal use, and no premium feature locked behind a subscription. Google offers it as a standard tool to help site owners maintain search visibility.
How long does it take for Google Search Console to show data?
New properties typically start showing Performance data within a few days of verification, though Google states it can take up to 48 hours for initial data and several days for the report to populate fully. Historical data only goes back to the date of verification, not before it, so setting up Search Console early on a new site matters.
Why is my page not showing up in Google Search Console?
A page might not show impressions data if it has received zero search impressions yet, which is common for very new content. Use the URL Inspection tool to confirm the page is actually indexed first, since a page with indexing errors will never generate Performance data no matter how long you wait.
What is the difference between Google Search Console and Google Analytics?
Google Search Console tracks visibility inside Google Search results before a click happens, including impressions, average position, and indexing status. Google Analytics tracks visitor behavior after they land on the site, including session duration, pages viewed, and conversions. They serve different stages of the traffic funnel.
How often should I check Google Search Console?
Check the Performance and Coverage reports at least once a week for active sites, and immediately after any major site change like a redesign, migration, or bulk content update. Waiting months between checks is how indexing problems go unnoticed and quietly cost traffic.
Can Google Search Console improve my rankings directly?
No, Google Search Console does not directly influence rankings. It is a diagnostic and reporting tool, not a ranking factor. However, using its data to fix indexing errors, improve Core Web Vitals, and optimize underperforming pages can lead to real ranking improvements over time.
What does “Discovered, currently not indexed” mean in Google Search Console?
This status means Google knows a URL exists, usually from a sitemap or internal link, but hasn’t crawled it yet. It often points to a crawl budget limitation on larger sites or signals that Google deprioritized the page based on perceived low value relative to other URLs on the site.
How do I fix a “Crawled, currently not indexed” error?
This usually means Google visited the page but decided the content wasn’t valuable enough to index, often due to thin content, duplication with another page, or low overall site quality signals. Improving the depth and originality of the content, then requesting reindexing through the URL Inspection tool, is the standard fix.
Does Google Search Console show competitor data?
No, Google Search Console only shows data for verified properties you own. It cannot show performance data, keywords, or rankings for competitor websites. For competitor analysis, a separate third-party SEO tool is needed alongside Search Console, since the two serve entirely different purposes and neither one replaces the other.
How far back does Google Search Console keep historical data?
Google Search Console retains up to 16 months of Performance data for most properties, which is enough to compare year-over-year trends for seasonal businesses. Coverage, Core Web Vitals, and other technical reports typically show a shorter rolling window, often around 90 days, so exporting data periodically matters for anyone who needs a longer historical record.
What is average position in Google Search Console?
Average position is the mean ranking position of a page or query across all the times it appeared in search results during the selected date range. A position of 3.5 means the page ranked at position 3 or 4 on average, factoring in variation across different searches, devices, and locations.
Should I submit every page manually using URL Inspection?
No, manual submission through URL Inspection should be reserved for new or recently updated important pages where faster indexing matters, such as a newly published cornerstone article. For routine content, a properly configured sitemap combined with strong internal linking is a more scalable approach than manually requesting indexing for every single URL.
Can I use Google Search Console for e-commerce and Shopify sites?
Yes, Google Search Console works the same way regardless of platform, including Shopify, WooCommerce, and custom-built stores. E-commerce sites benefit heavily from the Coverage report especially, since product variant URLs, filtered category pages, and out-of-stock items often generate duplicate content and indexing issues that this report catches early.